Week 7: July 14 ~ July 20
Preliminaries
In Week 7 of my GSoC journey, I focused on building and evaluating robust datasets for training deep learning models using the NVIDIA PilotNet architecture, an end-to-end neural network designed for autonomous driving exercise.
The primary goal was to create a balanced dataset that would enable the model to learn effectively from diverse follow-line driving scenarios, including sharp left/right turns and linear speeds.
Additionally, I implemented a cross-circuit evaluation strategy to assess the model's performance across different driving circuits. This approach allowed me to evaluate the model's generalization capabilities and its ability to adapt to new environments. By training the model on three (3) circuits and testing it on another, I aimed to identify its strengths and weaknesses in handling diverse driving conditions.
The results of this week’s work were promising, demonstrating the model's ability to learn from a balanced dataset and perform well across different circuits.
Overall, this week’s focus on dataset balancing and model training has laid a solid foundation for further advancements in autonomous driving technologies. The insights gained from the cross-circuit evaluation will be invaluable for future iterations of the model, enabling continuous improvement in its performance and adaptability to various driving scenarios.
Objectives
- Create circuit-based datasets by splitting 3 circuits for training and 1 for testing (4 combinations in total)
- Visualize angular velocity distributions in each dataset to understand steering diversity.
- Balance the datasets by applying upsampling/downsampling to maintain 5,000 samples per steering class.
- Train models using the NVIDIA PilotNet architecture on each dataset.
- Visualize training and testing loss to evaluate model performance and generalization.
Execution
The Follow-Line exercise in RoboticsAcademy features four distinct circuits, each with varying layouts, curves, and difficulty levels. Understanding how well a trained model performs on specific tracks can indicate its ability to generalize to previously unseen tracks. They are:
- Simple circuit
- Montreal circuit
- Montmelo Circuit
- Nürburgring circuit
I adopted a cross-circuit evaluation strategy by creating four separate datasets, each containing:
- Three circuits were used for training
- One distinct circuit was used for testing
Regarding the four unique follow-line circuit datasets, they are four possible datasets. They are:
-
Dataset: 1
Train: Simple, Montreal, Montmelo Circuit
Test: Nürburgring Circuit
-
Dataset: 2
Train: Simple, Montmelo, Nürburgring Circuit
Test: Montreal Circuit
-
Dataset: 3
Train: Simple, Montreal, Nürburgring Circuit
Test: Montmelo Circuit
-
Dataset: 4
Train: Montreal, Montmelo, Nürburgring Circuit
Test: Simple Circuit
Datasets Visualization
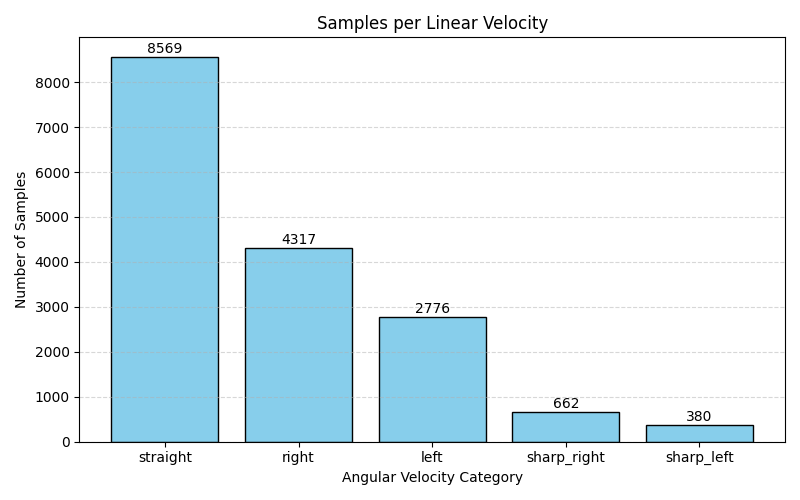
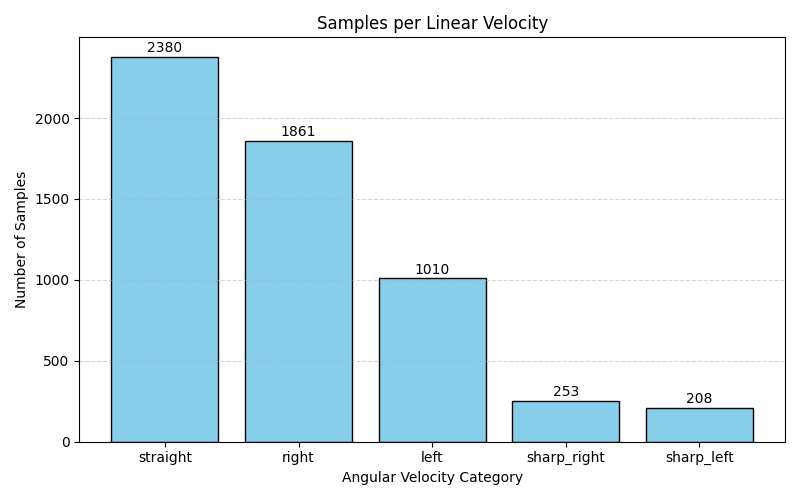
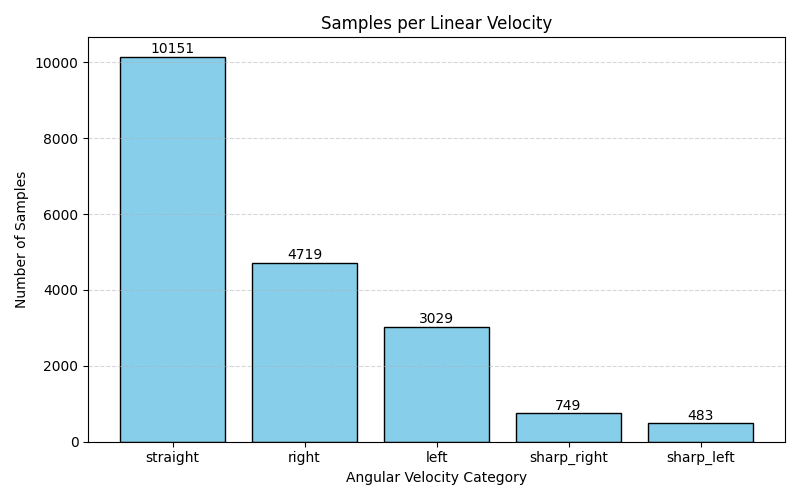
After preparing the datasets, I created angular velocity histograms to observe the distribution of steering directions in each split. This analysis revealed class imbalance, especially underrepresented sharp turns.
Dataset 01
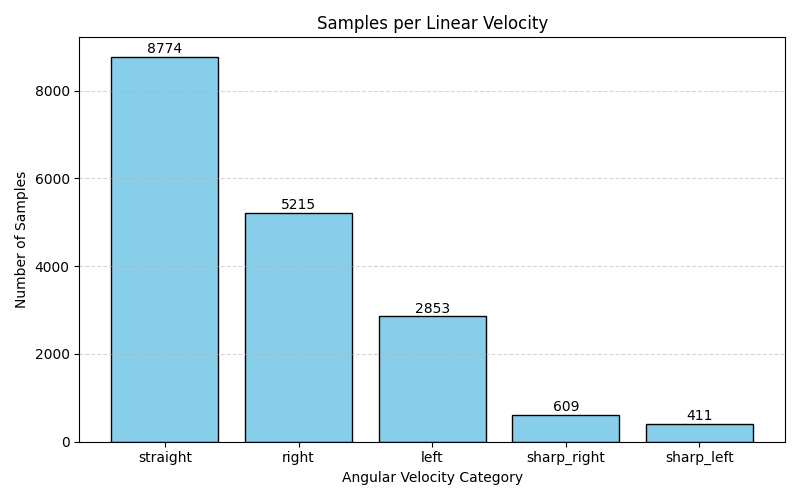 Train: Simple, Montreal, Montmelo
 Test: Nürburgring
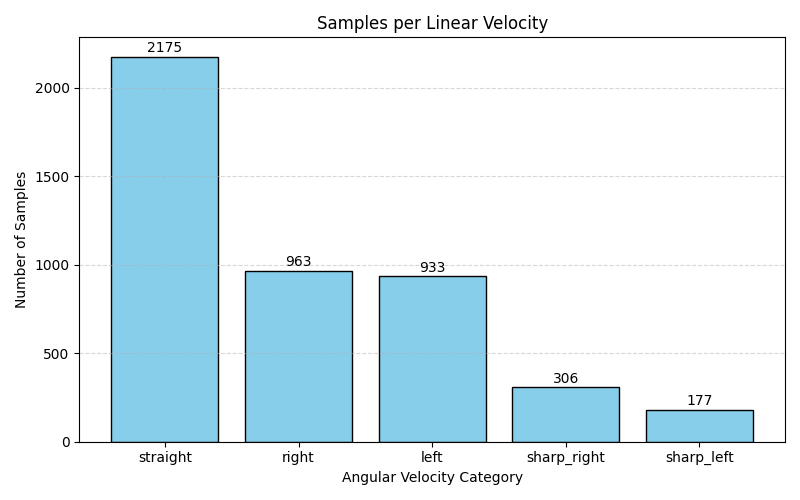
Dataset 02
 Train: Simple, Montmelo, Nürburgring
Circuit
Train: Simple, Montmelo, Nürburgring
Circuit
 Test: Montreal Circuit
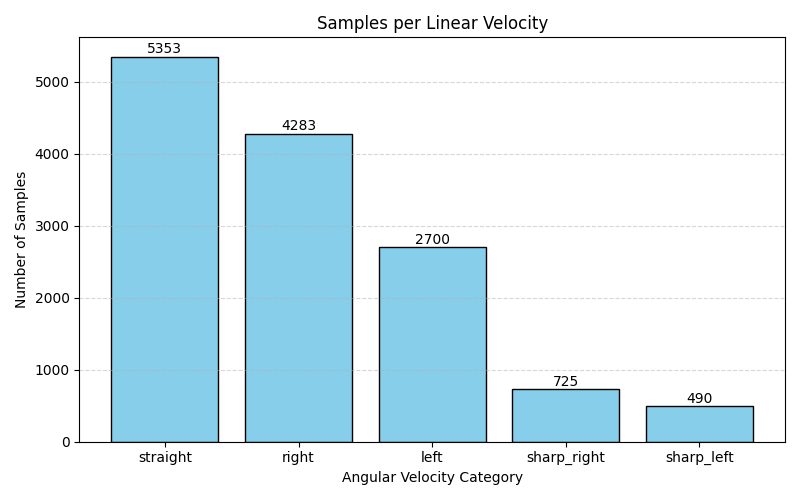
Dataset 03
 Train: Simple, Montreal, Nürburgring
Circuit
Train: Simple, Montreal, Nürburgring
Circuit
 Test: Montmelo Circuit
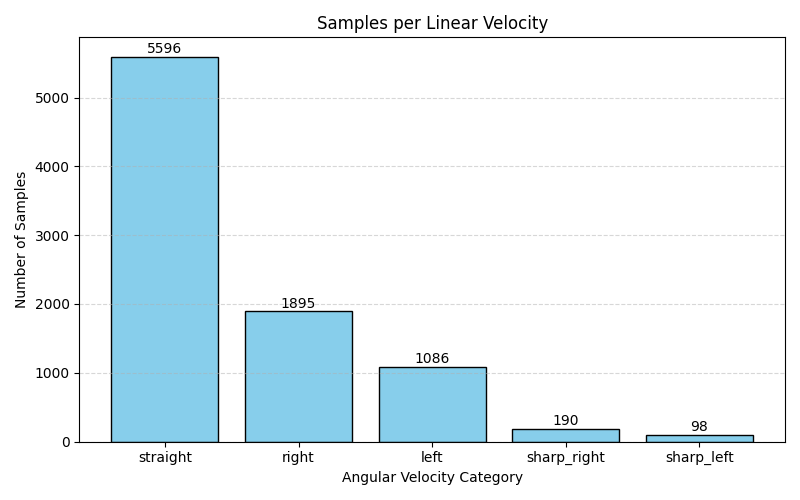
Dataset 04
 Train: Montreal, Montmelo, Nürburgring
Test: Simple
Train: Montreal, Montmelo, Nürburgring
Test: Simple
Balanced Datasets
To address the class imbalance, I applied upsampling and downsampling techniques to ensure that each dataset contained 5,000 samples per steering class. This balancing process was crucial for training the model effectively, as it allowed the model to learn from a diverse set of steering angles, including sharp turns and straight paths.
Each dataset was balanced based on angular velocity categories (Sharp Left, Slight Left, Straight, Slight Right, Sharp Right). To ensure consistency and fairness across all training scenarios:
- I upsampled underrepresented categories
- I downsampled overrepresented ones
to create exactly 5,000 samples per class, resulting in 25,000 samples per dataset.
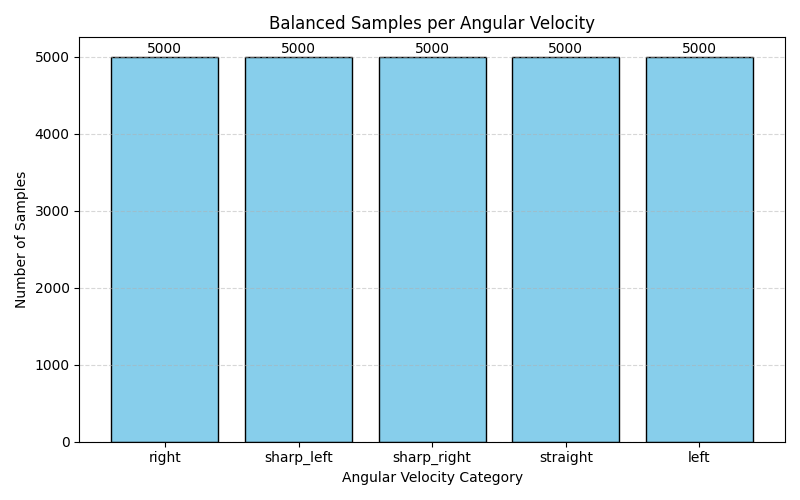 Example of balanced dataset
Model Training
The balanced datasets were then used to train the NVIDIA PilotNet model, which is designed for autonomous driving tasks. The model architecture consists of convolutional layers for feature extraction, followed by fully connected layers for decision-making. The model was trained using the Adam optimizer with a learning rate of 0.001 and a batch size of 64.
The training process was monitored using TensorBoard, which provided real-time visualizations of the training and validation loss. The model was trained for 50 epochs, with early stopping implemented to prevent overfitting. The training loss decreased steadily, indicating that the model was learning effectively from the balanced datasets.
Loss Visualization (PilotNet)
PilotNet is a convolutional neural network originally designed for end-to-end self-driving, and it fits well with our goal of mapping images to control commands.
For each training run:
- Training loss (MSE) to observe model learning progress
- Testing loss (MSE) to evaluate generalization on unseen circuits
- Evaluation matrix to analyze prediction accuracy
These plots helped identify overfitting, underfitting, and overall model performance for each dataset split.
Loss visualization of Dataset 01(Train:Simple, Montreal, Montmelo Circuit & Test: Nürburgring Circuit)
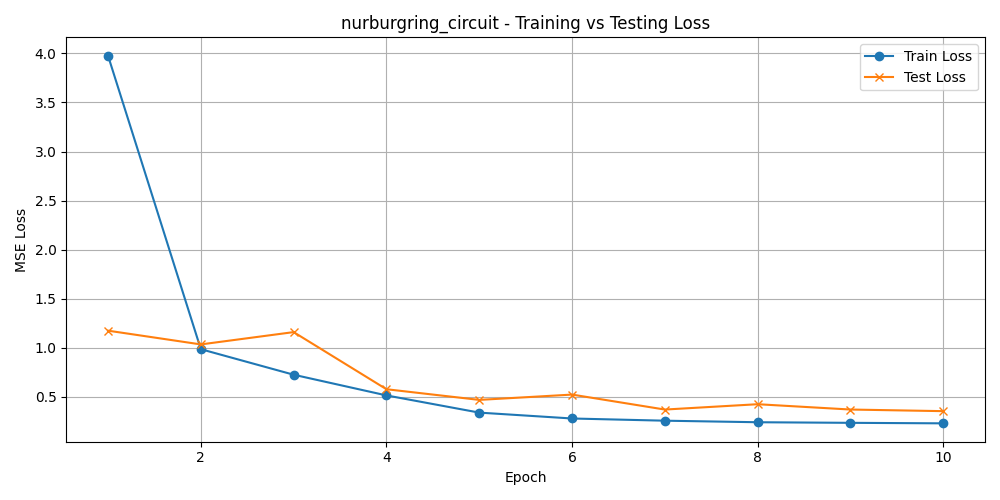 Train:Simple, Montreal, Montmelo & Test:
Nürburgring Circuit
Train:Simple, Montreal, Montmelo & Test:
Nürburgring Circuit
Evaluation matrix of Dataset 01(Train:Simple, Montreal, Montmelo Circuit & Test: Nürburgring Circuit)
| Category | MSE | MAE | R2 |
|---|---|---|---|
| Combined | 0.3517 | 0.3513 | 0.7922 |
| Linear Velocity (v) | 0.5948 | 0.4633 | 0.8626 |
| Angular Velocity (w) | 0.1086 | 0.2392 | 0.7219 |
Loss visualization of Dataset 02 (Train:Simple, Montmelo, Nürburgring Circuit & Test: Montreal Circuit)
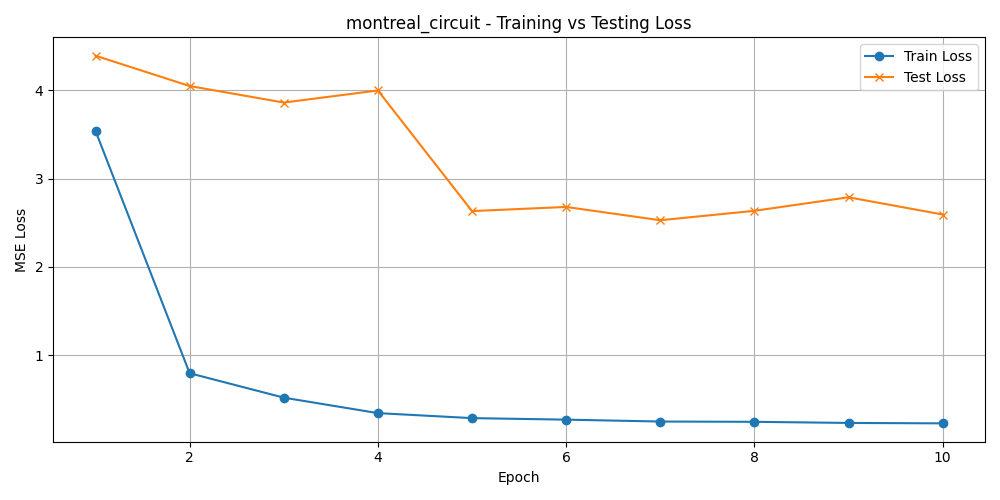 Train:Simple, Montmelo, Nürburgring Circuit &
Test: Montreal Circuit
Train:Simple, Montmelo, Nürburgring Circuit &
Test: Montreal Circuit
Evaluation matrix of Dataset 03 (Train:Simple, Montmelo, Nürburgring Circuit & Test: Montreal Circuit)
| Metric | Combined | Linear Velocity (v) | Angular Velocity (w) |
|---|---|---|---|
| MSE | 2.5937 | 5.1357 | 0.0518 |
| MAE | 1.0765 | 1.9917 | 0.1613 |
| R² Score | 0.2782 | -0.0292 | 0.5856 |
Loss visualization of Dataset 03(Train:Simple, Montreal , Nürburgring Circuit & Test: Montmelo Circuit)
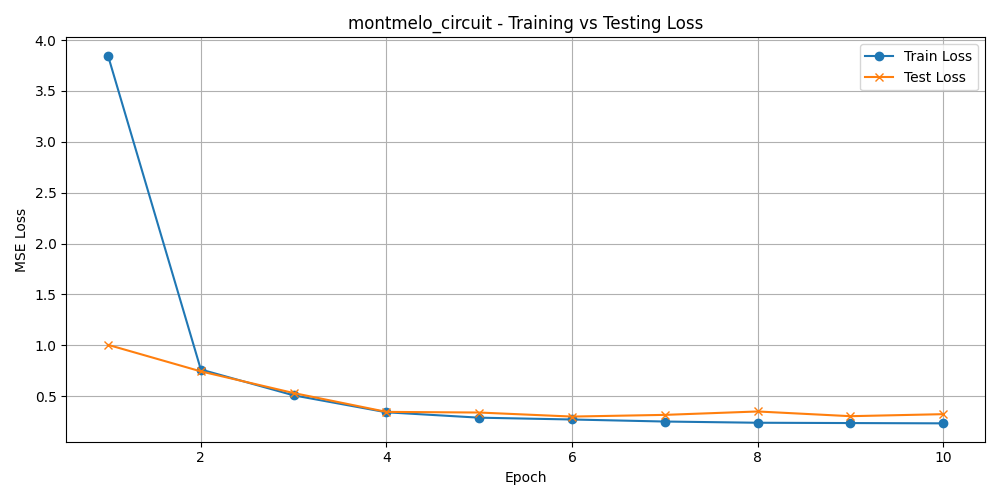 Train:Simple, Montreal, Nürburgring Circuit &
Test: Montmelo Circuit
Train:Simple, Montreal, Nürburgring Circuit &
Test: Montmelo Circuit
Evaluation matrix of Dataset 03(Train:Simple, Montreal , Nürburgring Circuit & Test: Montmelo Circuit)
| Metric | Combined | Linear Velocity (v) | Angular Velocity (w) |
|---|---|---|---|
| MSE | 0.3237 | 0.5738 | 0.0735 |
| MAE | 0.3339 | 0.4730 | 0.1948 |
| R² Score | 0.7956 | 0.8402 | 0.7509 |
Loss visualization of Dataset 4 (Train:Montreal, Montmelo, Nürburgring & Test: Simple Circuit)
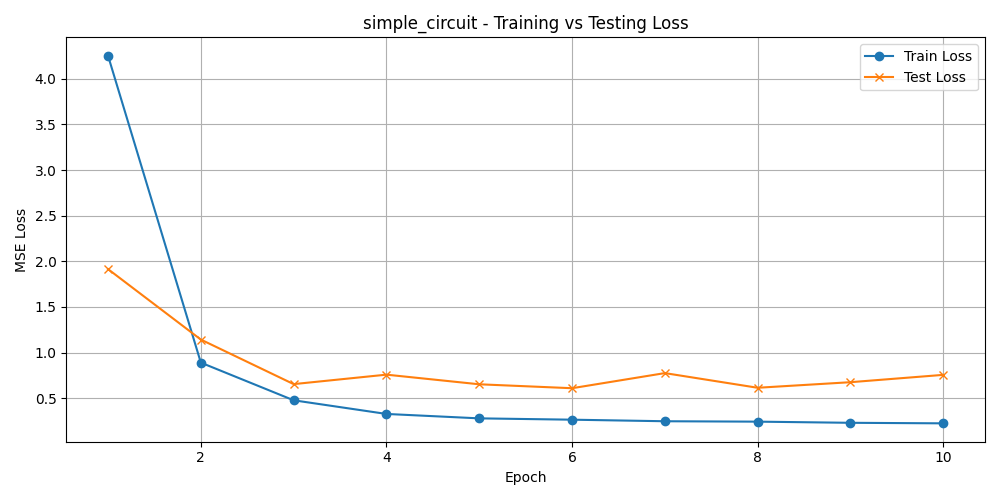 Train:Montreal, Montmelo, Nürburgring & Test:
Simple Circuit
Train:Montreal, Montmelo, Nürburgring & Test:
Simple Circuit
Evaluation matrix of Dataset 4 (Train:Montreal, Montmelo, Nürburgring & Test: Simple Circuit)
| Metric | Combined | Linear Velocity (v) | Angular Velocity (w) |
|---|---|---|---|
| MSE | 0.7552 | 0.8866 | 0.6237 |
| MAE | 0.6819 | 0.7238 | 0.6401 |
| R² Score | -0.0778 | 0.8151 | -0.9708 |
References
[1] NVIDIA PilotNet
Enjoy Reading This Article?
Here are some more articles you might like to read next: