Final Report
DetectionMetrics: GUI, CI Workflow, and Object Detection
Organization: JdeRobot
Contributor: Sakhineti Praveena
Mentors: David Pascual Hernández, Sergio Paniego, Santiago Montiel Marín
GSoC Project Page: DetectionMetrics: GUI, CI Workflow, and Object Detection
Hello everyone,
This report documents my journey through Google Summer of Code 2025 with JdeRobot. This summer, I had the opportunity to contribute to DetectionMetrics, an open-source toolkit for evaluating perception models across frameworks and datasets. My project focused on extending DetectionMetrics to support object detection models, building a more intuitive graphical user interface, and establishing a robust continuous integration (CI) workflow to streamline development and ensure code quality.
About me
I am currently working as an application developer with almost 2.5 years of professional experience. Google Summer of Code 2025 was my first major open-source experience, and it has been both exciting and rewarding. Working with the JdeRobot community and my mentors has helped me grow as a developer and deepen my understanding of perception model evaluation.
Project Summary
DetectionMetrics is a toolkit for evaluating perception models across frameworks and datasets. Past GSoC projects (Vinay Sharma, Jeevan Kumar) contributed to its first stable release, published in Sensors (Paniego et al., 2022). The tool was recently revamped to improve usability and installation. DetectionMetrics functioned as both a Python library and CLI, focusing on the quantitative evaluation of image and LiDAR segmentation models, with plans to expand into object detection. It supported PyTorch and TensorFlow models, along with multiple public datasets. Its modular design allowed easy integration of new models and datasets.
While redesigning the core functionality, some useful features were lost. This project aimed to bring them back and enhance DetectionMetrics by:
-
Recovering object detection evaluation support, including metrics like mAP and IoU. This involved restoring compatibility with COCO-style datasets and implementing necessary pipeline adjustments.
-
Building a GUI for visualizing dataset samples and evaluation results (IoU, confusion matrices, etc.). The GUI provides an interactive interface for launching batched evaluation jobs using Streamlit.
-
Setting up a Continuous Integration (CI) workflow to automate testing, documentation generation, and versioning using Sphinx, pytest, and GitHub Actions.
Contribution Summary
Stage 1: Object Detection Pipeline Development
In this phase I focused on building a comprehensive object detection evaluation pipeline. Since the segmentation classes already existed, I had to redesign the classes in a way that ensured minimum code repetition.
- Dataset Class Refactoring: Restructured the monolithic dataset class into a modular hierarchy with a base
PerceptionDatasetclass and specializedSegmentationDatasetandDetectionDatasetsubclasses. The same has been done for the model classes as well.
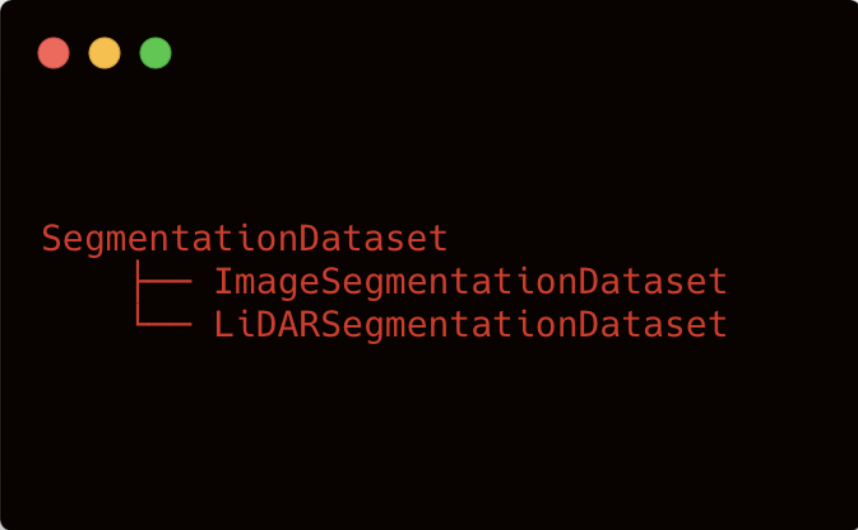
Old Class Structure
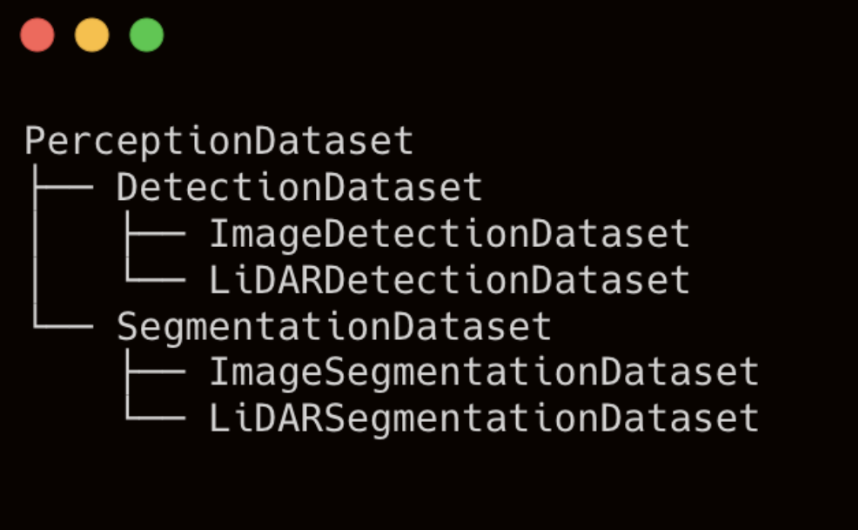
New Class Structure
- COCO Dataset Integration: Created
CocoDatasetclass with proper ontology mapping and annotation processing. Handled cross-platform compatibility issues withpycocotoolsfor Windows systems. - Torch Detection Model Support: Created
torch_detection.pyto support detection models, adapting data processing methods for detection-specific input formats (List[Dict[str, Tensor]]). - Detection Metrics Factory: Implemented
DetectionMetricsFactoryclass that computes per-class metrics (AP, Precision, Recall, TP, FP, FN) and returns results in a pandas DataFrame with mAP.
By the end of this stage, the object detection evaluation pipeline was fully functional as a Python library. To demonstrate its capabilities, I also created a sample Jupyter notebook, which walks users through the evaluation process step by step. You can view the notebook here: tutorial_image_detection.ipynb.
Stage 2: GUI Development
In this stage I focused on another major part of the project, designing and implementing a user-friendly, interactive GUI using Streamlit.
The GUI features a persistent sidebar for entering dataset and model details, which remains accessible across all tabs. This unified input system streamlines the workflow and ensures consistency, while warning banners and tooltips guide users to provide any missing information required for each stage. The main interface is organized into three main tabs, each tailored to a specific stage of the model evaluation workflow:
- Dataset Viewer Tab:
This tab allows users to explore and inspect the loaded dataset in detail. Users can:- Browse through individual samples using navigation controls (next/previous buttons and image index selection).
- Visualize images with overlaid ground truth bounding boxes, each class color-coded for clarity.
- View annotation details such as class labels, bounding box coordinates, and image metadata.
- Search for specific images by filename.
- The tab is designed to help users verify dataset integrity and annotation correctness before running evaluations.
- Inference Tab:
The inference tab provides an interface for running the selected detection model on custom images. Key features include:- Uploading one or more images for inference, either by selecting from the dataset or uploading new files.
- Configuring model parameters (e.g., confidence threshold, NMS threshold) directly from the sidebar.
- Visualizing inference results with predicted bounding boxes, class labels, and confidence scores overlaid on the images.
- Comparing predictions with ground truth annotations (if available) for qualitative assessment.
- Exporting inference results as JSON files for further analysis or integration with other tools.
- Evaluator Tab:
This tab is dedicated to comprehensive model evaluation and result analysis. Its features include:- Real-time progress tracking with a progress bar and status updates.
- Displaying evaluation metrics such as mAP@0.5, mAP@0.5:0.95, per-class AP, precision, recall, and F1-score in tabular format.
- Visualizing precision-recall curves, with the option to download the curve data as CSV.
- Exporting the full evaluation results as CSV files for reporting or further processing.
- The tab also supports live updates of metrics if the model supports step-wise evaluation, allowing users to monitor performance as evaluation progresses.
Stage 3: Performance Optimization and Integration
Focused on optimizing performance and ensuring seamless integration:
- Loading Time Optimization: Reduced dataset loading from 42 seconds to 11 seconds through strategic caching and session state management.
- Inference Performance: Fixed inference slowdowns, achieving 2-3 second initial load times and sub-second subsequent loads.
- Advanced Metrics: Implemented mAP@0.5:0.95 with step size 0.05 and Area Under Curve (AUC) for precision-recall curves. Also included plotting precision-recall curve in the evaluator tab.
- Unified UI Design: Created a sidebar-based input system that persists across all tabs, eliminating redundant input sections.
Stage 4 : Testing and Documentation
During this stage, I devoted significant time and effort to thoroughly test both the Python library and the GUI, ensuring robust functionality across a wide range of scenarios and edge cases. This comprehensive testing process allowed me to identify and resolve several minor bugs, further improving the stability and reliability of the system. In the final week, my focus shifted to documentation. I updated and expanded the user guide, which is maintained within the DetectionMetrics repository, to provide reference material for end users. This ensures that new users can easily understand and utilize all the features developed during the project.
On GitHub
Over the summer, I submitted 3 major pull requests that have been merged, each representing significant milestones and progress throughout the project. Below is a detailed breakdown of the work accomplished week by week, with each row highlighting a distinct contribution or enhancement:
| Pull Request | Description | More |
| #312 | Initial implementation of object detection evaluation pipeline: COCO-format dataset support, PyTorch model integration, and core metric computation (mAP, precision, recall). | Week 1, Week 2 |
| #312 | Added example Jupyter notebook for object detection evaluation; fixed bugs in dataset loading and metric calculation. Finalized object detection pipeline, improved dataset handling, and prepared for GUI integration. | Week 3, Week 4 |
| #318 | Initial Streamlit GUI: dataset viewer tab, image navigation, and annotation visualization. Added inference tab: model upload, parameter configuration, and inference visualization. | Week 5, Week 6, Week 7 |
| #318 | Performance optimizations: reduced dataset loading and inference times, improved session state management. Bug fixes and UI refinements: persistent sidebar, tooltips, warning banners, and improved user experience. | Week 8, Week 9, Week 10 |
| #319 | Enhanced GUI: evaluator tab with real-time metrics and persistent sidebar. Comprehensive documentation: updated user guide, and usage tutorials for both library and GUI. | Week 11, Week 12 |
Demo Video
Future Work
The foundation built during this project paves the way for a wide range of exciting enhancements and new features. Here are some promising directions for future development:
1. Pipeline and Backend Improvements
- Broader Framework Support:
Expand compatibility to include additional model frameworks such as TensorFlow, YOLO, and ONNX, as well as support for more dataset formats like Pascal VOC and LabelMe. - Modular Metrics Architecture:
Refactor the metrics factory classes to follow a more modular and extensible design, mirroring the structure used for datasets and model classes. This will make it easier to add new metrics or evaluation strategies in the future. - Extensive Tutorials and Templates:
Expand documentation with more real-world examples, video walkthroughs, and ready-to-use templates for common workflows.
2. User Interface Enhancements
- Advanced Filtering and Visualization:
In the dataset viewer and inference tabs, add options to filter and visualize ground truth and predicted bounding boxes by class, confidence score, or other attributes. - Performance Optimization:
Further reduce computation time, especially when live progress tracking is enabled in the evaluator tab, by leveraging asynchronous processing or background workers. - Ground Truth vs. Inference Comparison:
Integrate side-by-side or overlay visualizations to directly compare ground truth annotations with model predictions in both the inference and evaluator tabs. - Model Comparison Tools:
Develop a dedicated comparison tab where users can upload and compare evaluation results from multiple models, including side-by-side metric tables and visualizations.
These enhancements will not only broaden the applicability of the tool but also make it more powerful, user-friendly, and adaptable to the evolving needs of the computer vision community. I look forward to seeing how the project grows and how the community builds upon this foundation!
Conclusion
Participating in Google Summer of Code 2025 with JdeRobot has been an incredibly rewarding and transformative journey. Working on this project allowed me to deeply explore computer vision and model evaluation, helping me develop a strong understanding of object detection metrics, dataset management, and modern web application development. Throughout the summer, I significantly improved my skills in computer vision, UI/UX design, and effective collaboration within a distributed team.
Beyond the technical growth, GSoC connected me with the vibrant and supportive open-source community at JdeRobot. I am especially grateful to my mentors—David, Sergio, and Santiago—who supported me throughout the summer. Their continuous guidance made a huge difference to the project. I am also deeply thankful to the JdeRobot administrators for giving me this wonderful opportunity.
This experience has been a fgreat kick-start for my open-source journey, and I am excited to see what the future holds. Thank you for following along!
Enjoy Reading This Article?
Here are some more articles you might like to read next: