Week 10 (Aug 4 - Aug 11)
Meeting with Mentors
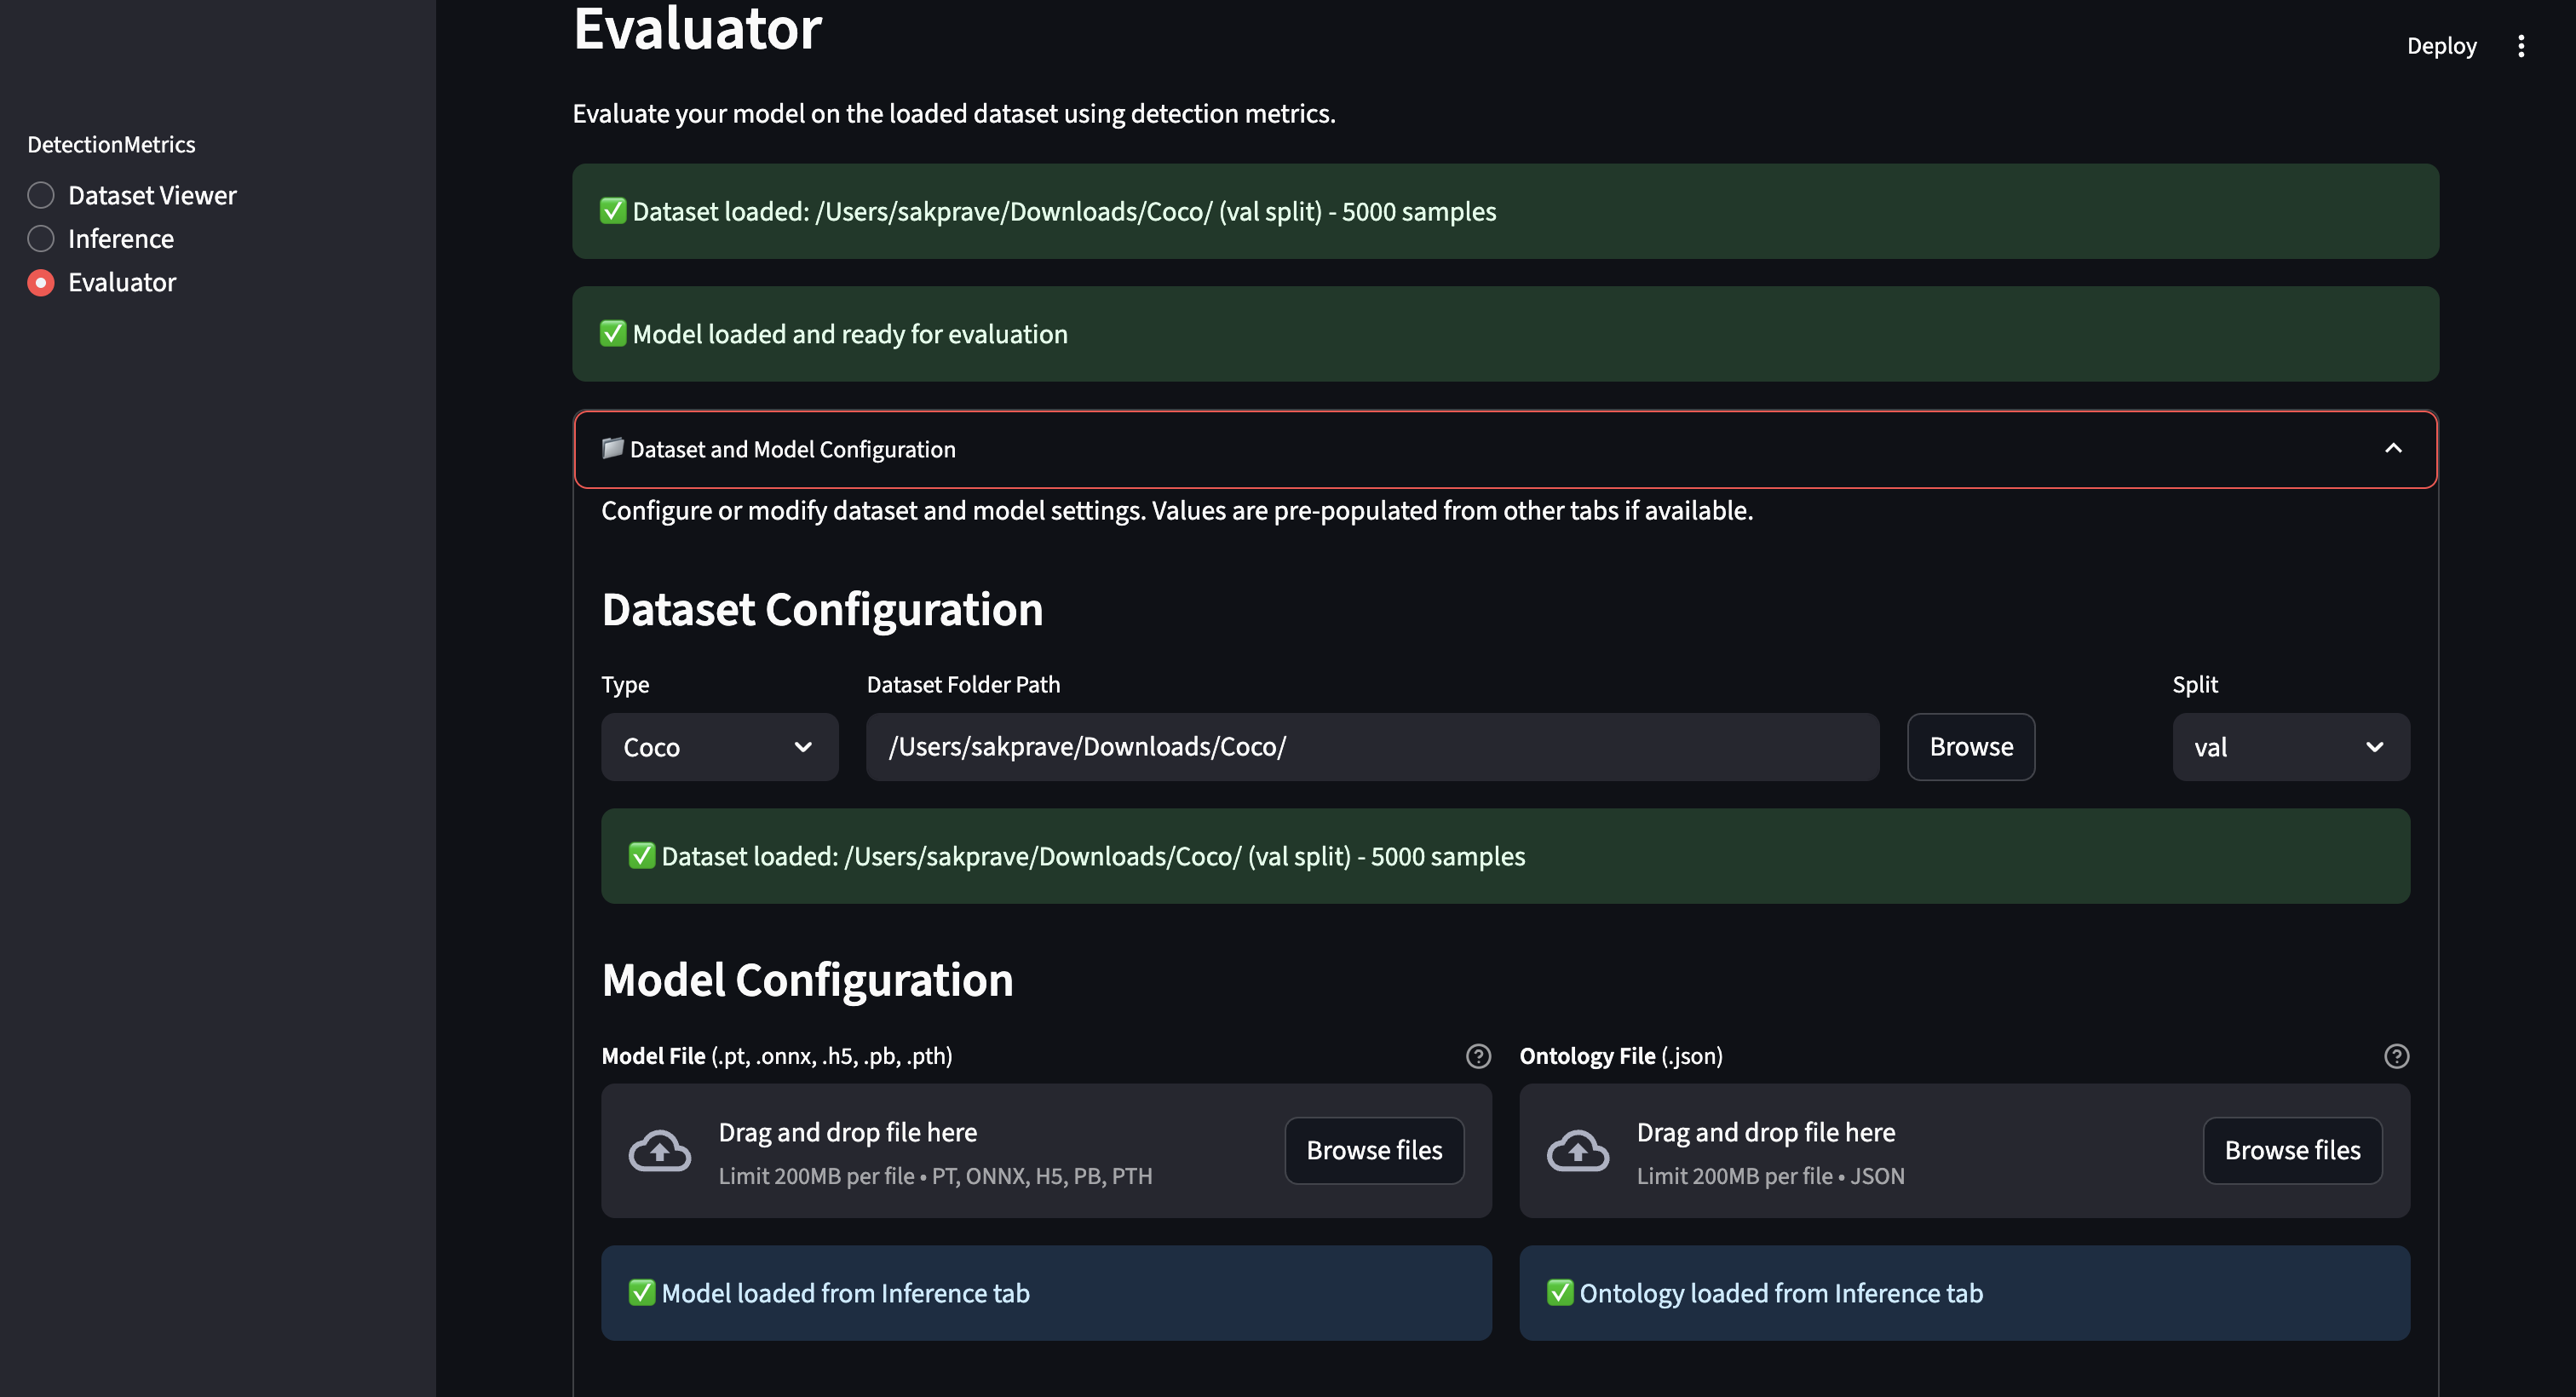
- I met with Sergio this week. I started with showing him what I have about the evaluator tab. Towards the end of last week, I actually explored having the dataset and model saved from the other two tabs and being able to run the evaluation on those. I showed him the approach I tried where we get the data from the other two tabs but also let the user edit them.

- Sergio let me know that it is better to have the same pipeline, as in not have two places where we let the user give the data. But we also discussed that for the user to just run the evaluation, it makes more sense to also let the user edit the details in the evaluator tab. So for now, we have decided to let it be there this way where we do load the data given in the other two tabs but also let the user edit in this tab.
- Later we discussed regarding my doubt in extending the metrics for a range of IoU thresholds. Sergio clarified that supporting the standard 0.5:0.95 with a step size of 0.05 is enough from a user perspective. I let him know that I also plan on adding area under the curve (AUC).
- He also suggested to think about the information that we could provide to the user while we run the evaluation. For that, he also suggested that I should add the ‘Evaluation step’ parameter. The user should be able to give the value for steps after which we keep updating the UI with the metrics. As in for a dataset sample of 5000, if the user gives a step size of 100, we should be calculating the metrics for every 100 images and keep updating in the UI.
- We have also discussed about comparing two results which could be implemented later on in the project.
- He let me know that for now the basic requirement of the project is almost there, from now on it would be extending the tool.
To Do for This Week
- Extending the metrics, adding plots and images in the evaluator tab
- Adding evaluation step parameter
- Refining the UI
Progress
- This week I started with extending the metrics, like discussed in the call last week. I have added the mAP@0.5:0.95 with the step size of 0.05.
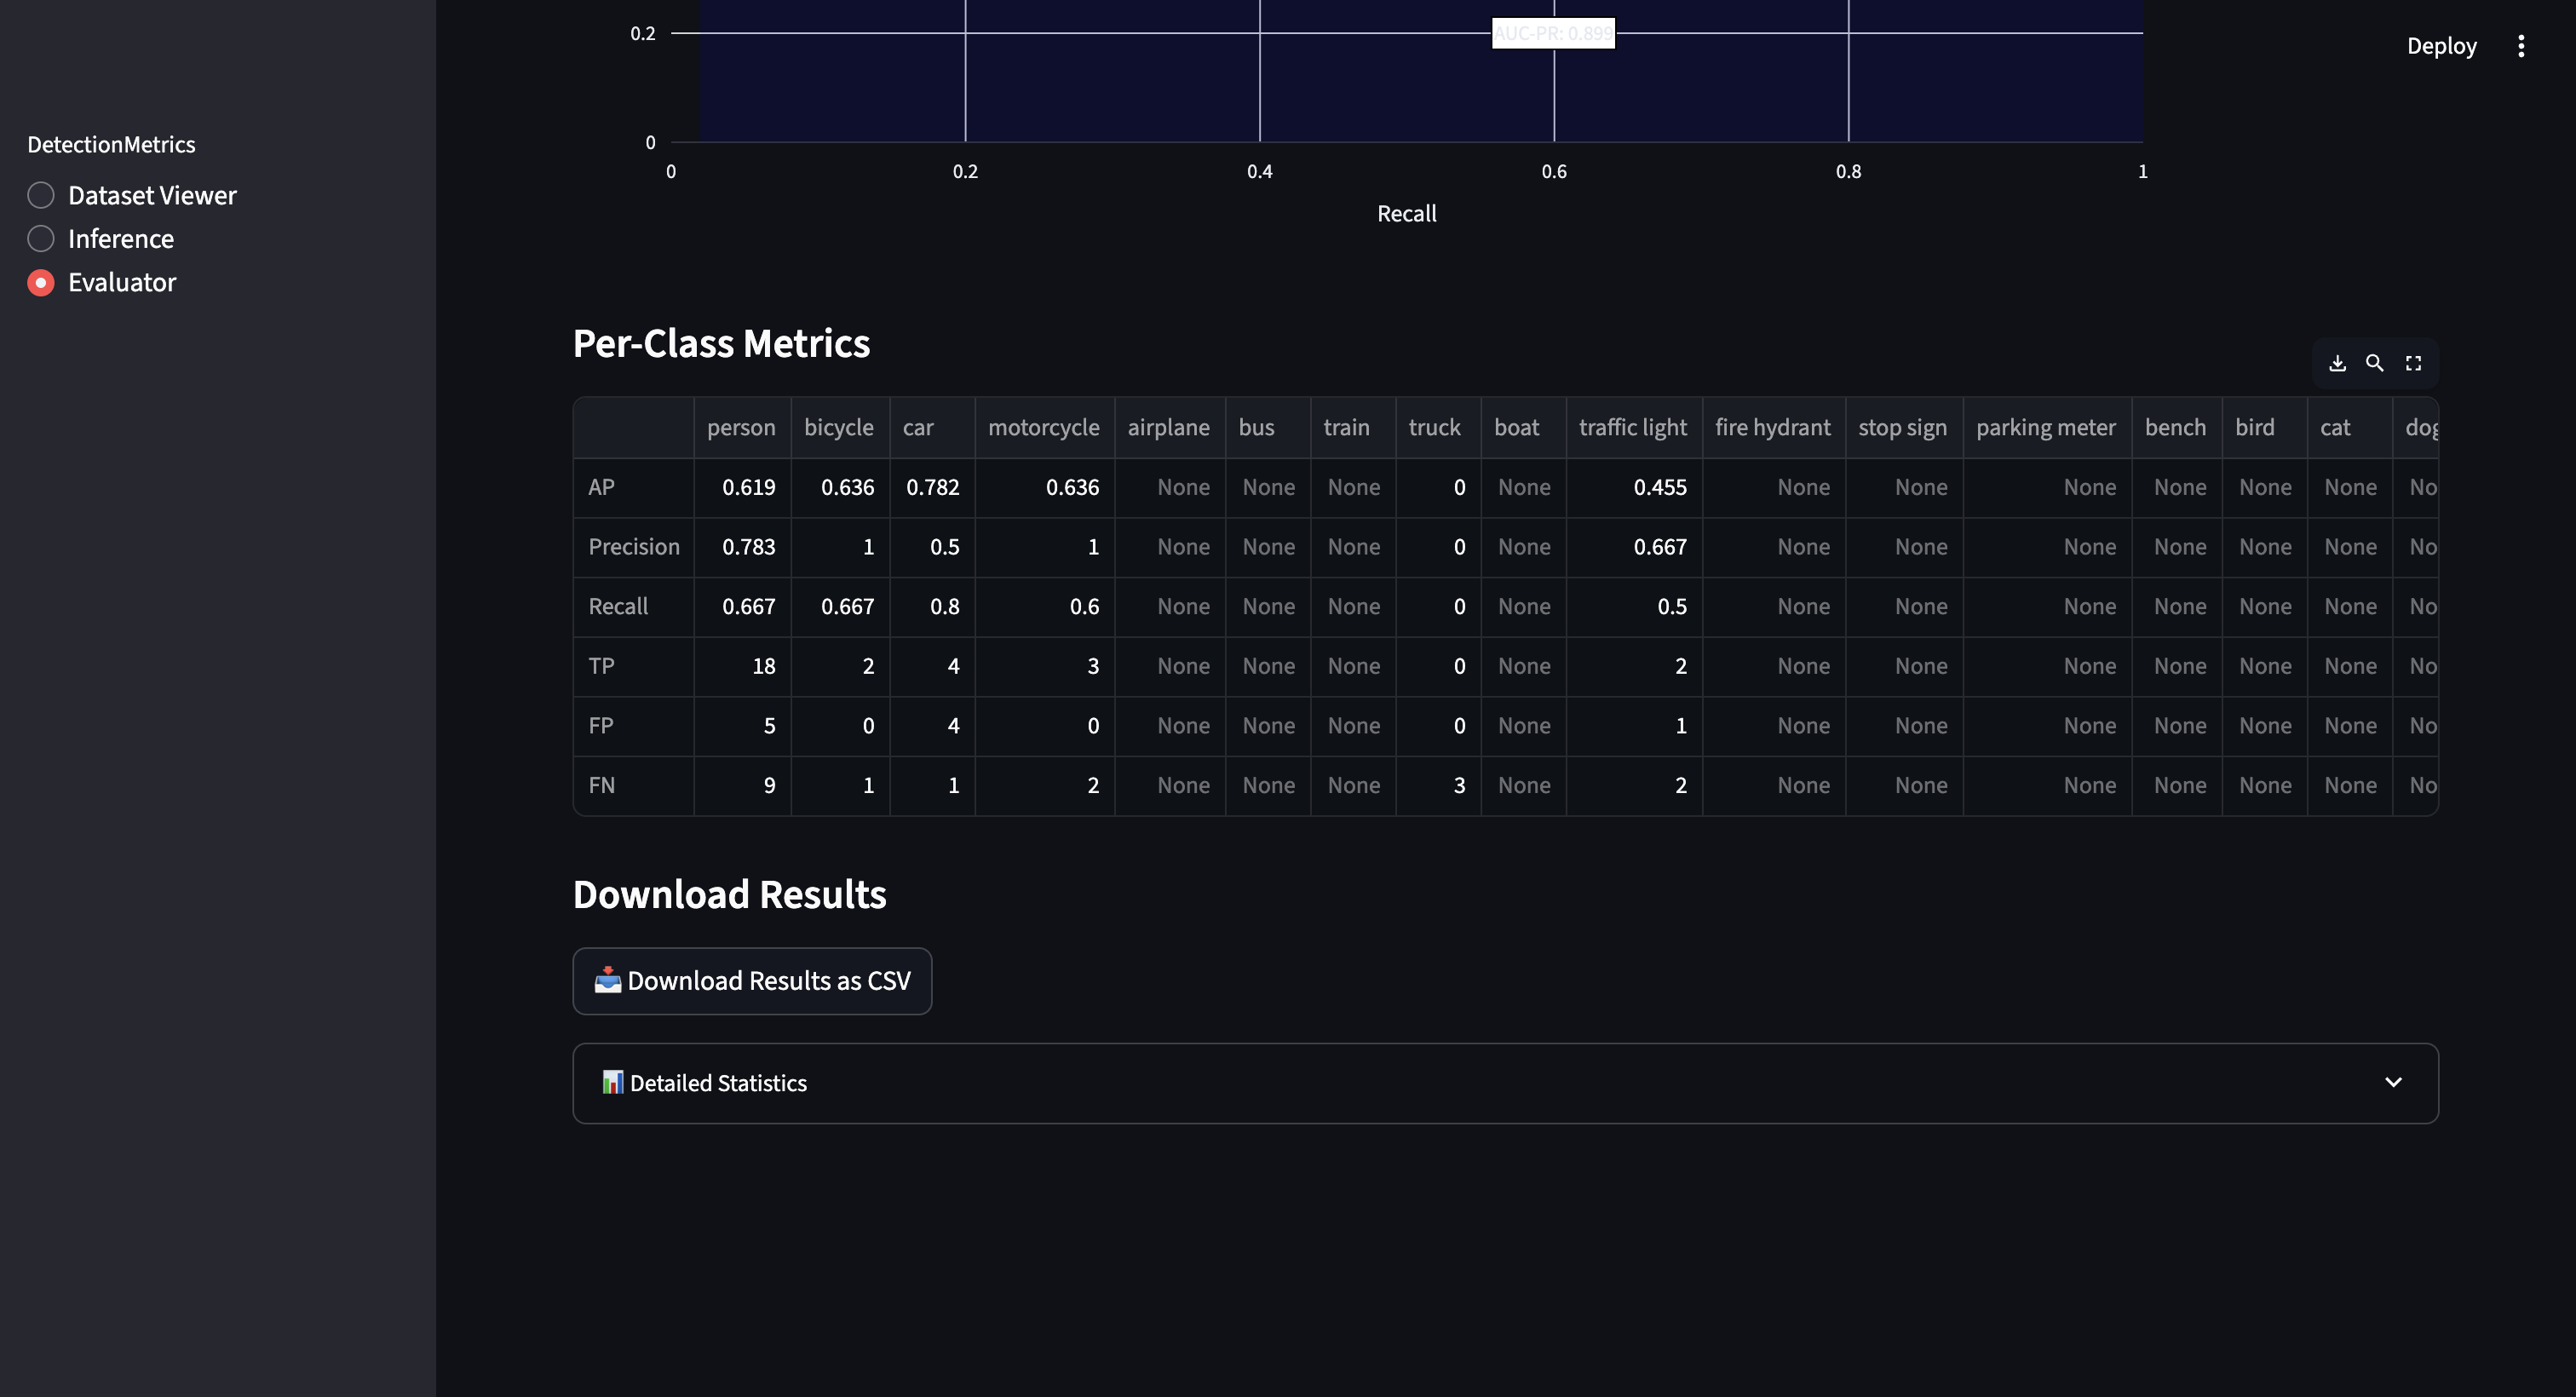
- I have also added the precision-recall points that can be used to plot in the UI to be included in Detection Metrics Factory class. In the results dataframe, I have added the mAP@0.5:0.95 and the Area under the precision-recall curve (AUC-PR) details. Now the evaluation function returns both the dataframe and the metrics factory object also.
- I have also edited the tutorial notebook to show the precision-recall curve.
- In the UI also, I have added showing the added metrics in the summary and also plotted the precision-recall curve.


- Later I started concentrating on refining the UI. Last week I have tried adding a collapsible input section in evaluator tab where the user can also edit the values that are preloaded from the other tabs. But when I was testing the flow, it had a lot of issues since having to create another pipeline again to take the values in. So for now, I have reverted the respective UI changes and kept the older version of it.
- The idea I have in mind right now is that I could probably get the values from dataset and inference tabs and if they are absent only then I can display the collapsible section in evaluator tab for the user to give the inputs without switching tabs. I will discuss this idea with the mentors this week and proceed with the changes.
- I have also done a bit of testing. I found that after adding the support to add progress bar in the UI, evaluating for a batch size of more than 1 is failing. I need to look more into the issue and fix it this week.
- Since I got sick towards the end of the week, I couldn’t finish adding the evaluation step parameter to show the results live while evaluation is still processing. I will take it up this week.
What’s Next?
- Fixing the issues found
- Adding evaluation step parameter to show live results
- Documentation
Enjoy Reading This Article?
Here are some more articles you might like to read next: