Coding Period: Week 2
This week was all about complete recovery from Covid-19 and working on scripts for analysing DL brains in Behavior Metrics.
Objectives
- Preliminaries and Explore Issues
- Solve Issues with Pull Requests
- Analyze the PyTorch PilotNet Brain
Preliminaries and Explore Issues
Behavior Metrics is all about analyzing the performance of brains using not only the conventional neural network metrics but also judging a brains overall task performance. While it is very easy to generate robags with the recorded data for every simulation run, there was a lack of internal visualizations. Recently, an internal visual analysis of rosbag, behavior_metrics/show_plots.py[1] was added by Sergio, JDERobot member.
With this as the beginning, this week’s task was to sort the inetrnal visualization tools. I found the following issues:
Issue 1: Publish First image as a separate image topic for analysis in script mode
All the required data is added in the form of String ROS messages. This was also done for the image data. So, the image data was converted to a list and then to a string, and the reverse was done to obtain the image while reading the ROS bag. As a minor change, this can be done with Image ROS messages.
Issue 2: Introduce Random spawning flag and conditions to both graphics and script mode
In the script mode, while doing the analysis for the performance of brains, the initial position for the F1 car was randomized using a dynamically generated launch file [2]. These random positions were sampled from the perfect lap checkpoints. This test is definitely a strong metric to judge the robustness of the brain. However, it was not included in the GUI mode. Having it in GUI mode will also help in visualization of how the brains actually perform.
Issue 3: First Image in script mode is broken while in GUI mode works perfect
While initializing the simulation in script mode, the delay caused between the completion of the gazebo launch and launching of brain sends broken images to brain which is stored as the first image without any check. This leads to some errors while analyzing the ROS bags. This issue, being dependent on the system used, is not yet resolved and requires further discussion.
Solve Issues with Pull Requests
To solve the above issues and add new clean functionalities, the following PRs were created:
PR 1: Cleaned primary behavior metrics directory
This is a minor refactoring of the primary directory for Behavior Metrics. This directory has a lot of activity with perfect lap bags and configs for all the configurations used till date. Such a structure unnecessarily populates, so, the configs were shifted to behavior_metrics/configs/ and the perfect lap bags were shifted to behavior_metrics/perfect_bags/. The configs were modified according to the new paths.
PR 2: Added Image Topics while saving
The issue with Image ROS message for recording the first image is fixed with the CvBridge [3] setting. The updated flow just revolves around CvBridge().cv2_to_imgmsg and CvBridge().imgmsg_to_cv2 to convert between Image message to opencv-image while recording and reading respectively. All related existing scripts were changed to follow this update.
PR 3: Added random spawning flags for both GUI and script mode
A similar strategy like that in script mode is done and a new common function is introduced to generate the dynamic temporary file and launching that with or without visualization as required. This module can be found in [4]. The new function is more generalized with flags to inlclude GUI or directly launch the file from within. Further, what to randomize and by how much can be better controlled both in GUI and script mode.
PR 4: Added new analysis to save plots with no display
Finally, the behavior_metrics/show_plots.py file uses the QtWindow to generate it runtime on the DISPLAY. So, the new script setup as found in behavior_metrics/scripts/analyze_brain.bash [5] eases the overall process by first collecting the ROS bags with the confg file provided and then generates all the analysis plots. Finally, it saves everything at behavior_metrics/bag_analysis/bag_analysis_plots/ directory sorted according to the different circuits.
Analyze the PyTorch PilotNet Brain
The current formulation of the saving plots analysis creates the following directory structure:
behavior_metrics/bag_analysis
	├── bag_analysis_plots/
	|	└── circuit_name/
	|   	├── performances
	|   	|   ├── completed_distance.png
	|   	|   ├── percentage_completed.png
	|   	|   ├── lap_seconds.png
	|   	|   ├── circuit_diameter.png
	|		|	└── average_speed.png
	|   	├── first_images/
	|		└── path_followed/
	└── bags/
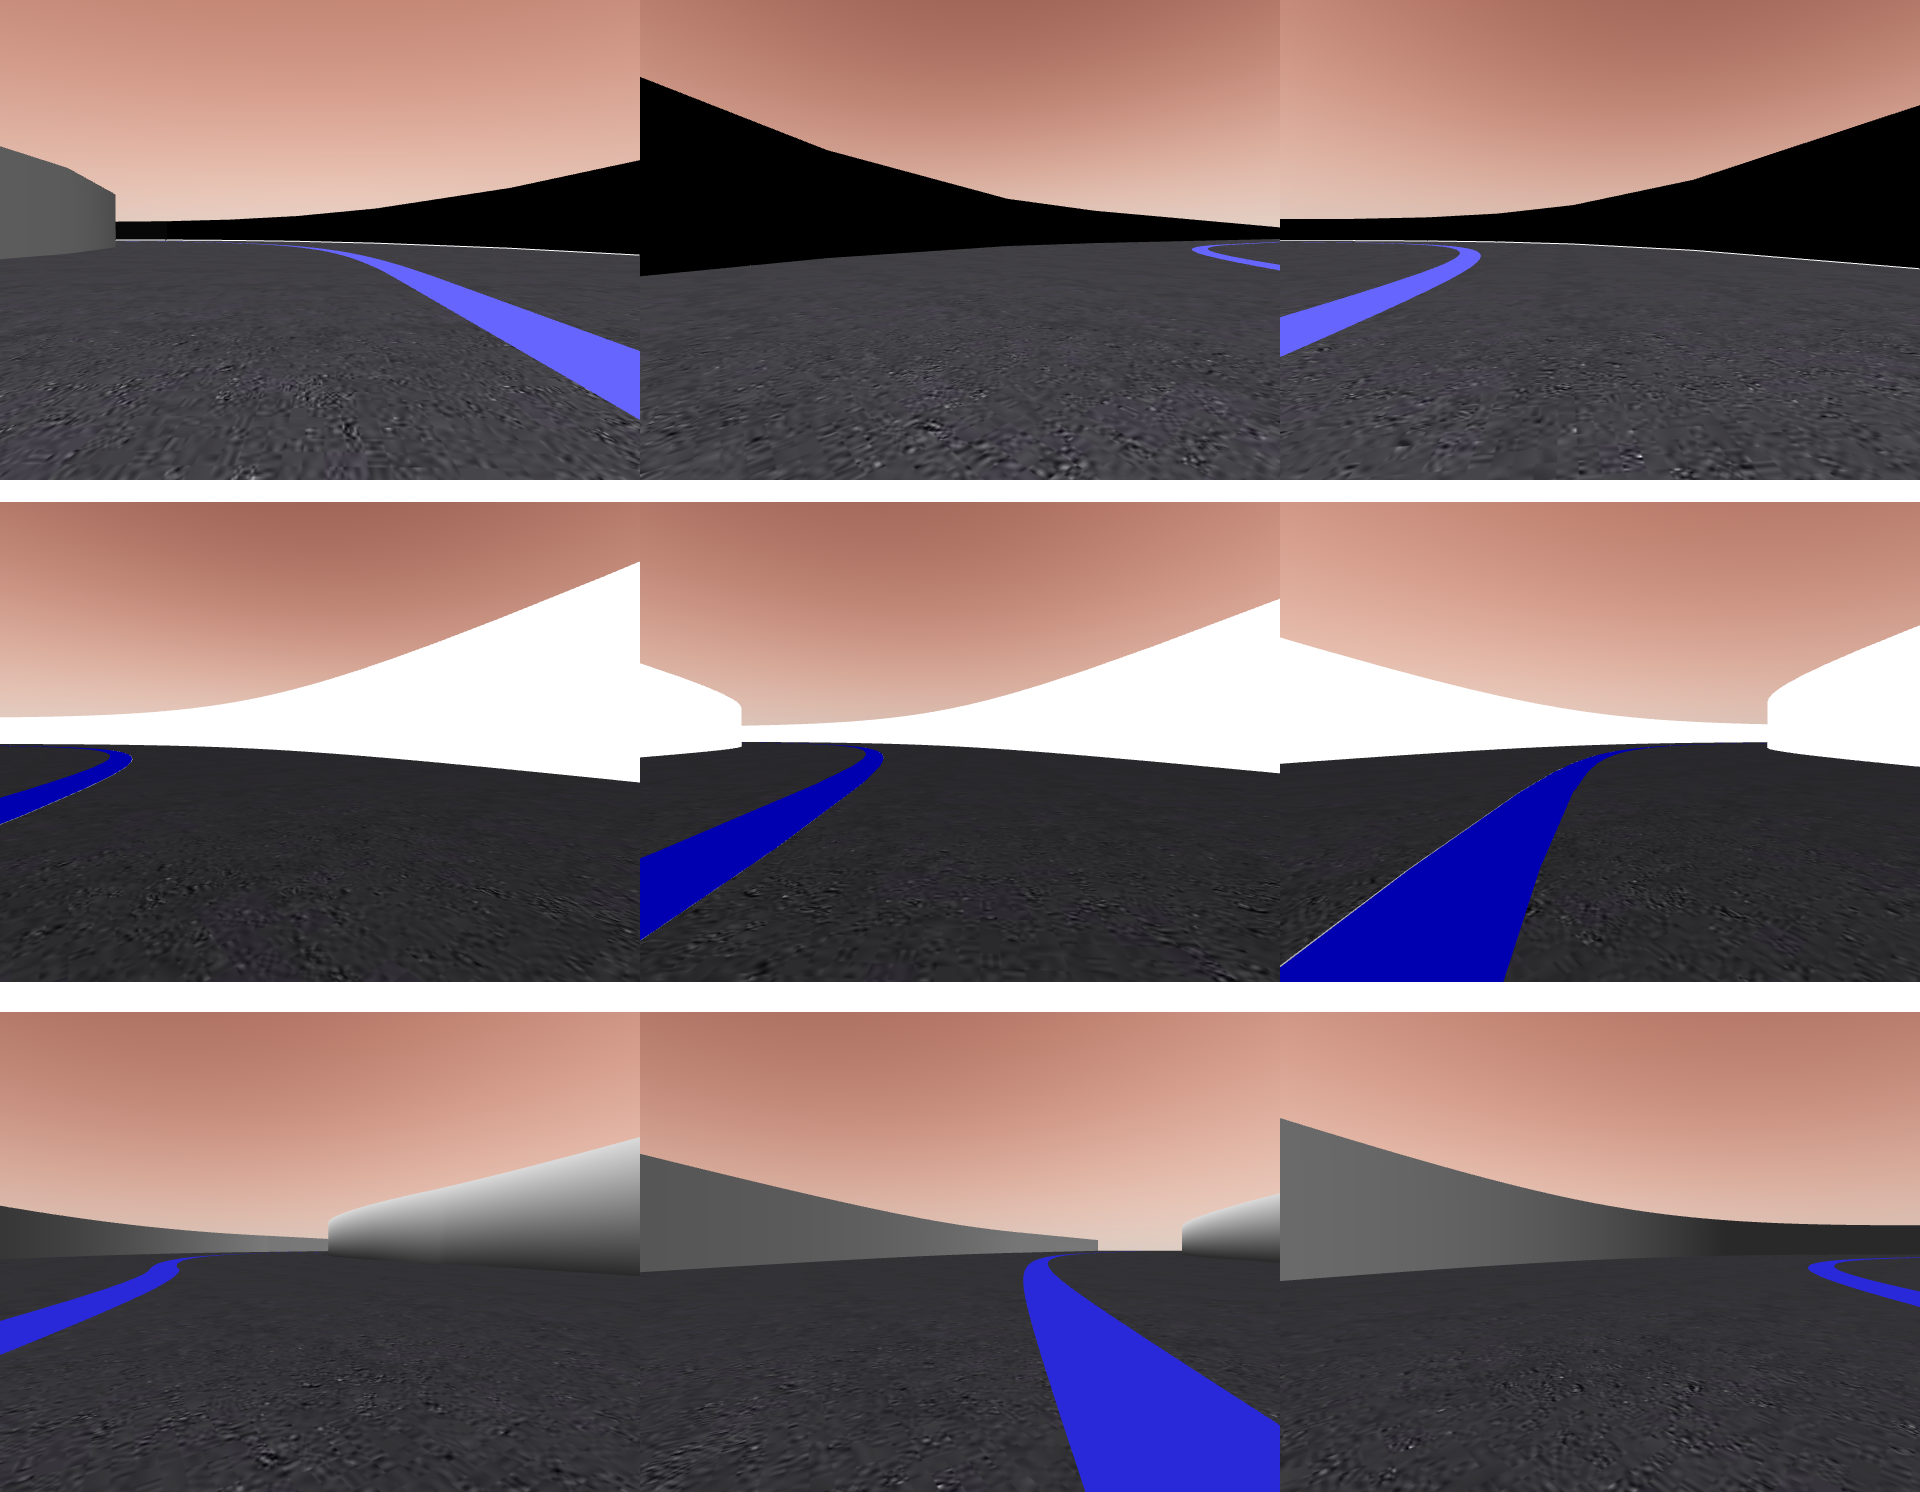
First Image Analysis
An example of first image analysis for simple_ciruit, many_curves and nurbergring circuits are goven in the figure below:

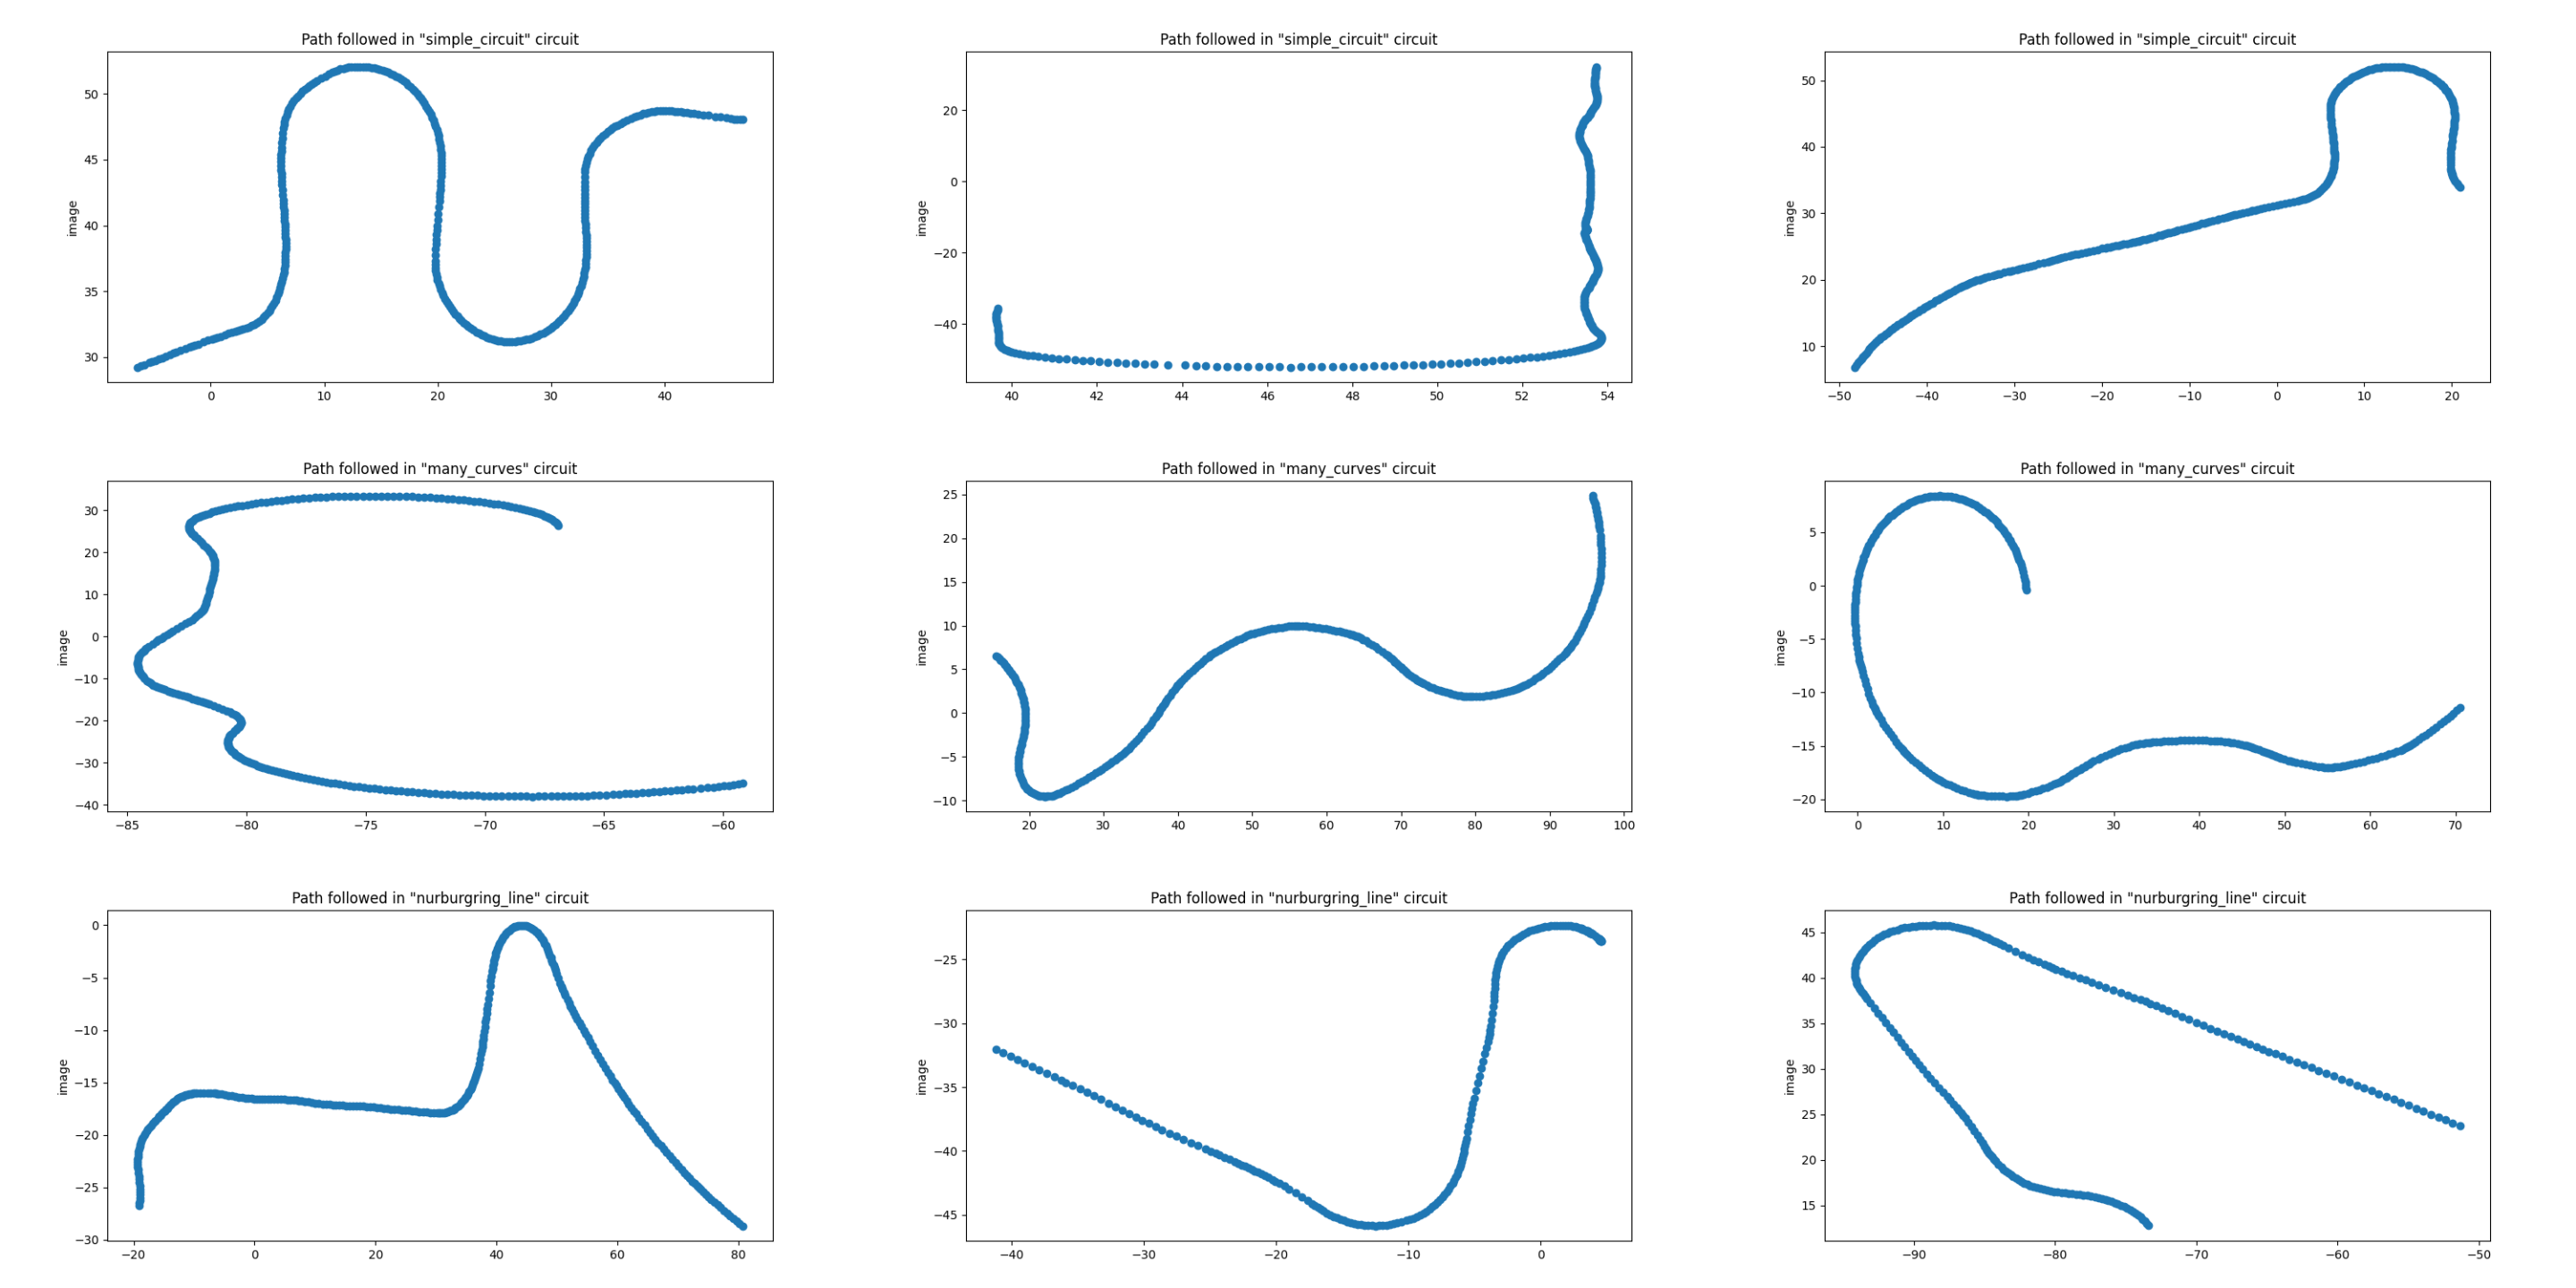
Path Followed Analysis
An example of path followed by the F1-car for several trails in the simple_ciruit, many_curves and nurbergring circuits are given in the figure below:

Metric: Distance Completed
An example of the distance traversed by the car for all the trials in simple_ciruit, many_curves and nurbergring circuits are given in the figure below:

Metric: Percentage Completed
An example of the percentage completed plots for all the runs in simple_ciruit, many_curves and nurbergring circuits are given in the figure below:

References
[1] https://github.com/JdeRobot/BehaviorMetrics/blob/noetic-devel/behavior_metrics/show_plots.py
[2] https://github.com/JdeRobot/BehaviorMetrics/blob/noetic-devel/behavior_metrics/utils/script_manager.py
[3] http://wiki.ros.org/cv_bridge
[4] behavior_metrics/utils/random_initializer.py
[5] BehaviorMetrics/behavior_metrics/scripts/analyze_brain.bash
Issues and Pull Requests
Issues Created
[1] https://github.com/JdeRobot/BehaviorMetrics/issues/177
[2] https://github.com/JdeRobot/BehaviorMetrics/issues/178
[3] https://github.com/JdeRobot/BehaviorMetrics/issues/179
Pull Requests Created
[1] https://github.com/JdeRobot/BehaviorMetrics/pull/182
[2] https://github.com/JdeRobot/BehaviorMetrics/pull/183
[3] https://github.com/JdeRobot/BehaviorMetrics/pull/184
[4] https://github.com/JdeRobot/BehaviorMetrics/pull/185