Coding Period Week 6
This week I continued working on the PerceptionMetrics GUI. The main focus was to make the task-based GUI structure more useful for image segmentation, while also starting a first experiment for LiDAR segmentation visualization.
In the previous weeks, the GUI was split into task folders so that image detection, image segmentation, and LiDAR segmentation could have their own sidebar, dataset viewer, inference tab, and evaluator tab. This week I worked more on filling in the image segmentation parts.
Pull Requests
The main pull request related to this week’s GUI work is:
- Image segmentation GUI: JdeRobot/PerceptionMetrics#609
Image Segmentation GUI
I first continued with the image segmentation dataset viewer. Cityscapes and nuImages were the datasets I focused on. Other datasets can be added later by adding the required sidebar inputs and dataset viewer logic in the sidebar.py and dataset_viewer.py files.
The viewer now uses the dataset path and dataset-specific inputs from the sidebar. For Cityscapes, this includes the image directory, label directory, image suffix, label suffix, and whether train IDs are being used. For nuImages, this includes the dataset version and the generated labels directory.
The GUI shows the selected image along with the ground-truth mask overlay. This helped in checking whether the labels were being read correctly and whether the mask was aligned with the image.
I also connected nuImages segmentation to the dataset viewer. For nuImages, the GUI uses the dataset version and the generated labels directory from the sidebar.
Model Inputs for Segmentation
I worked on the model input part of the image segmentation sidebar. The model input can either be a model file path or a Hugging Face model folder. Since the current Cityscapes and nuImages examples use Hugging Face SegFormer models, I focused on making sure the GUI can handle those models correctly. The basic option for Torch model files is present, but the main tested flow for now is the Hugging Face model folder path. Support for other .pt or .pth model-loading cases can be extended with small changes in the model loading function.
So the sidebar now asks for:
- model path or Hugging Face model folder;
- model config JSON;
- model ontology JSON.
This follows the same idea as the tutorials, where the model is wrapped by the PerceptionMetrics model class using a config file and an ontology file.
For Hugging Face SegFormer models, I checked how the downloaded model folder and config files should be passed.
Inference and Evaluation
I also worked on the image segmentation inference and evaluator tabs.
For inference, the GUI lets the user upload an image and run prediction using the loaded segmentation model. The prediction is then visualized using the model ontology, similar to how the tutorial visualizes predictions. It is very similar to the inference tab of image detection.
For evaluation, the GUI uses the same model.eval() path from PerceptionMetrics. Similar to the tutorials and the evaluation tab of image detection.
I also added support for ontology translation in the evaluator. This is important for datasets like Cityscapes and nuImages, where the dataset labels and model output labels may not always use the same IDs.
One issue that came up while testing was Streamlit session state. I tried simplifying some browse buttons by removing small callback functions, but Streamlit does not allow changing a widget key after the widget has already been created in the same run. Because of that, browse buttons that update text input fields still need callback functions.
LiDAR Segmentation Viewer Experiment
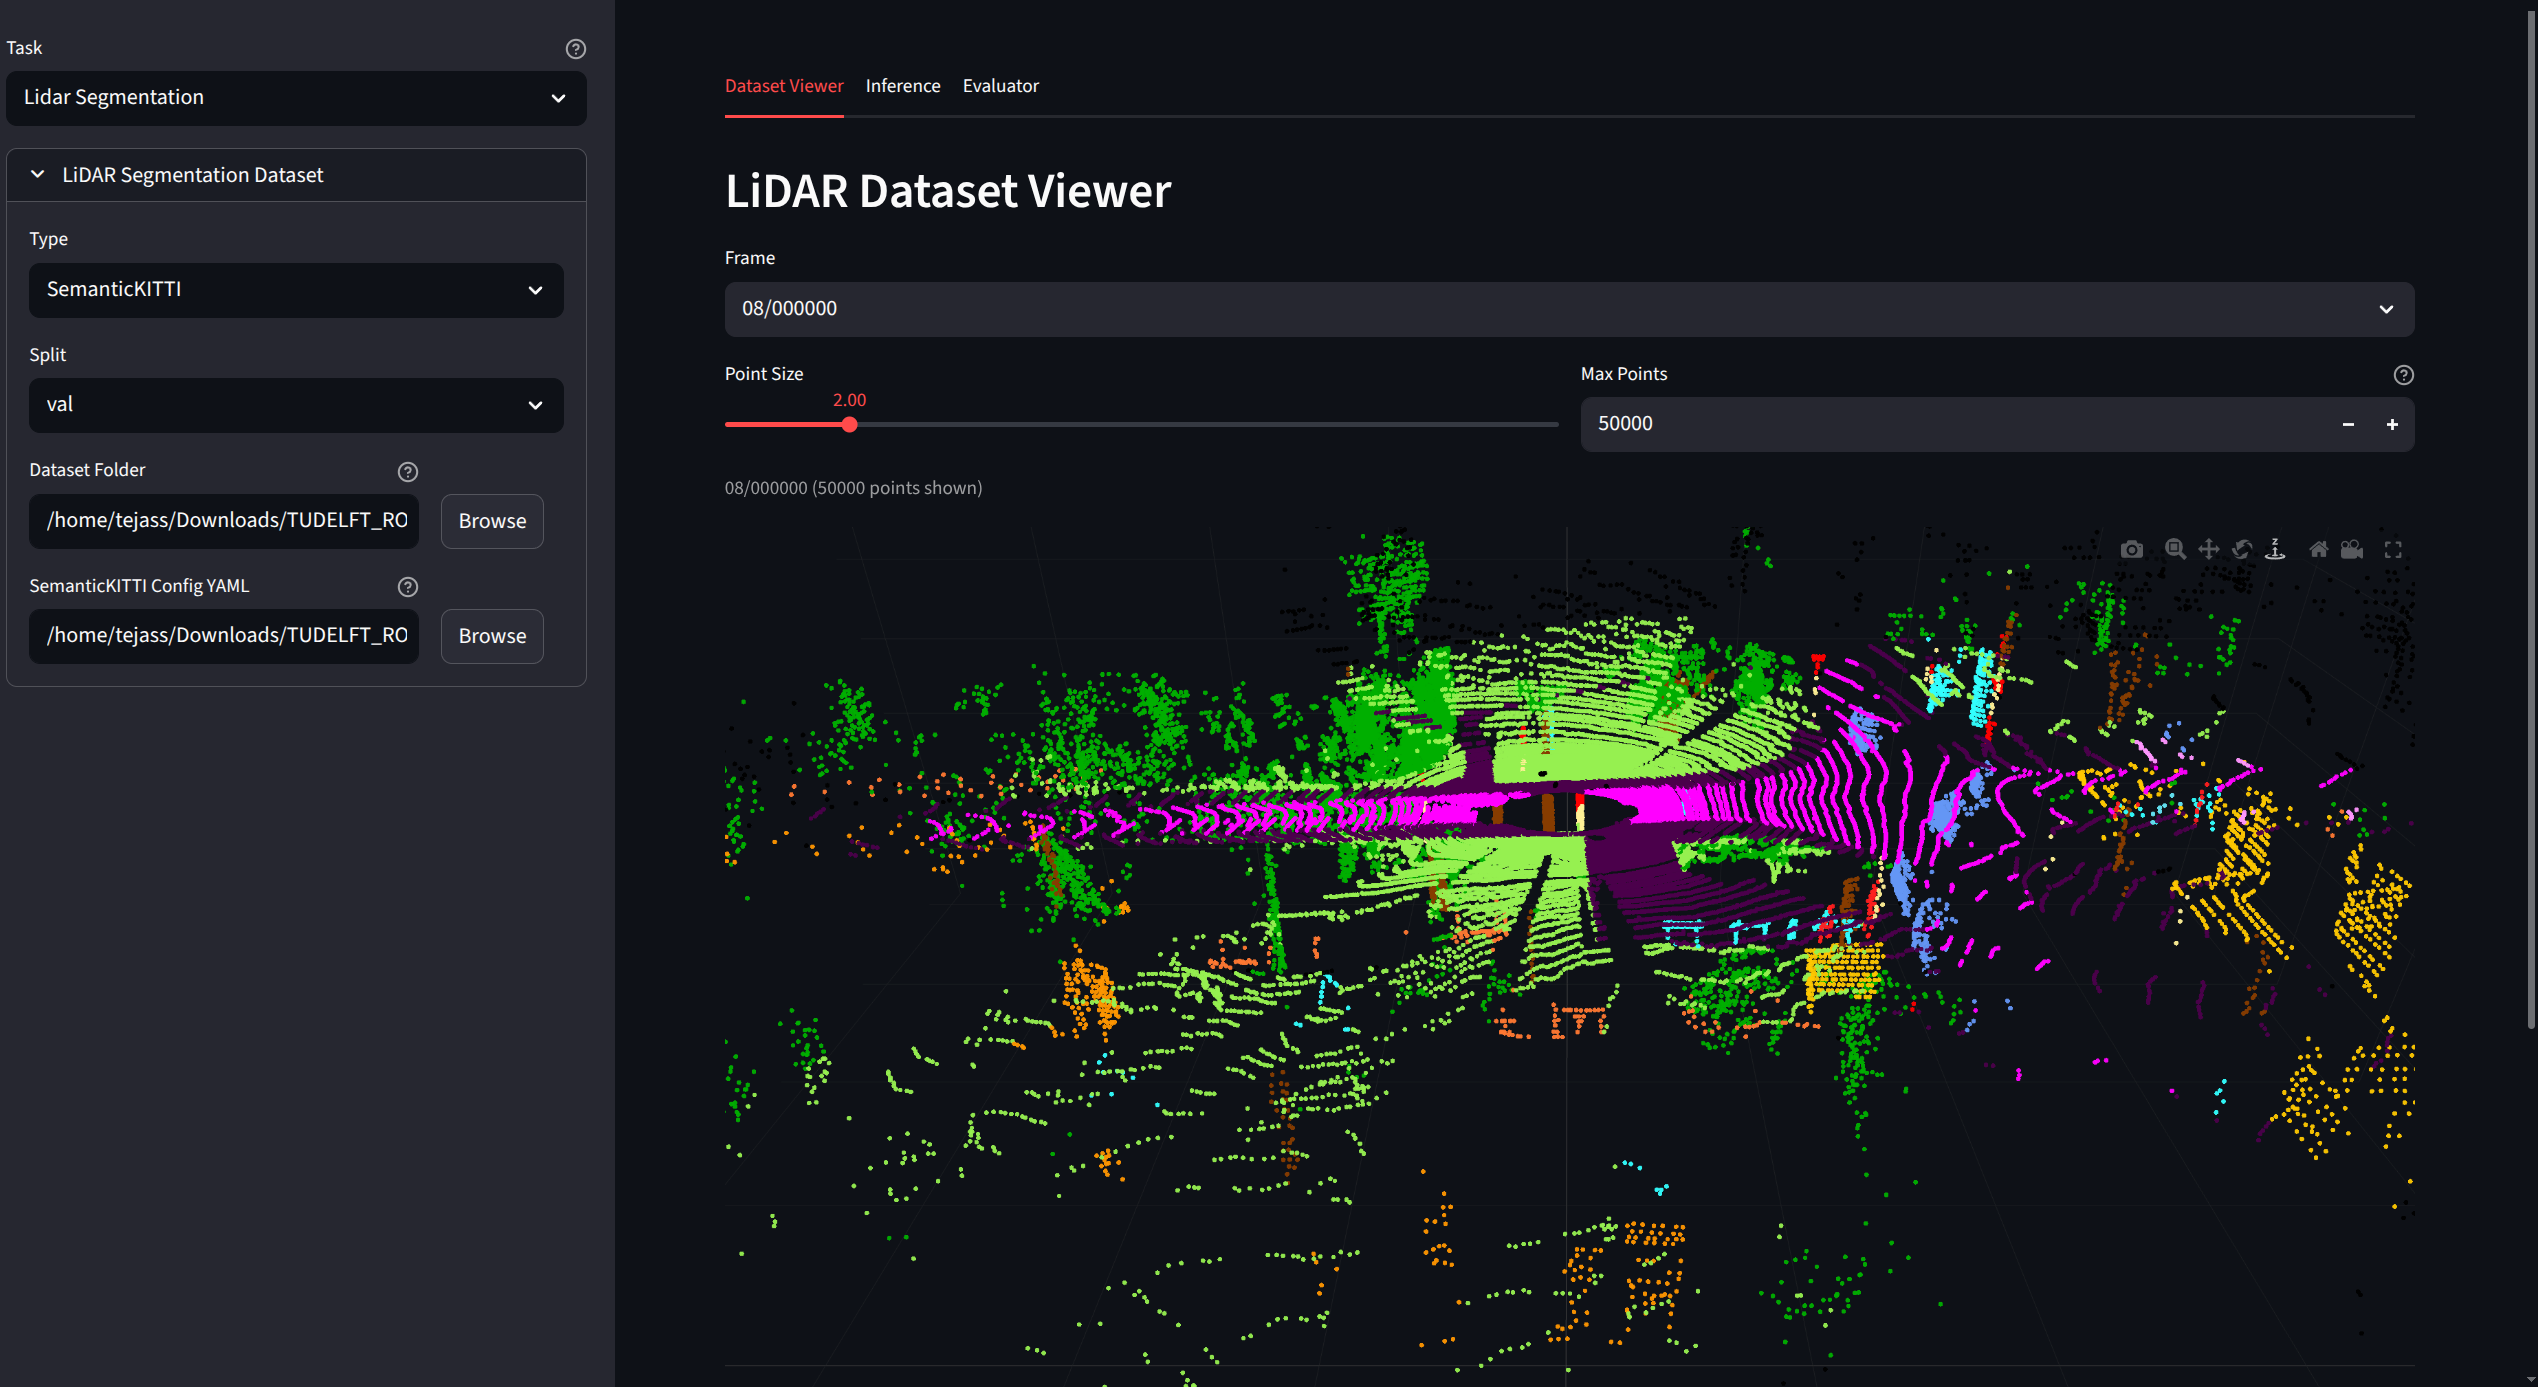
As suggested by David and Praveena in the previous week, I also started a small experiment for LiDAR segmentation visualization using SemanticKITTI.
The viewer scans the SemanticKITTI folder structure, lists available frames by split, and renders the selected point cloud. It can also use the SemanticKITTI YAML config to color points by labels when label files are available.
I first wanted to try Open3D, but for embedding inside Streamlit, I used a Plotly-based 3D view for now. This gives an interactive point cloud directly in the browser and is easier to test inside the current GUI.
The Plotly-based viewer supports panning, rotation, and zooming. It also shows the point coordinates when hovering over the point cloud. This makes it useful for quickly checking whether a SemanticKITTI frame is being loaded and rendered correctly.
One issue I faced was that the Plotly viewer needs WebGL support in the browser. On my system, I had to enable Override software rendering list in Chrome settings before the 3D point cloud rendered properly.
As discussed with David and Praveena, the visualization can also be extended later to provide rendered images from fixed views, such as top view and front view. These views could be useful for evaluation and visualization inside the GUI.
The maximum number of rendered points can also be controlled from the sidebar. I kept the default at 50K points. I tried 100K points as well, but the browser started to lag, so 50K is a better default for now. This limit can be increased later if needed.
Next Steps
I will be completing the LiDAR segmentation viewer and adding inference and evaluation support for SemanticKITTI.
Enjoy Reading This Article?
Here are some more articles you might like to read next: