Coding Period Week 7
This week, the main focus was to extend the GUI support for LiDAR segmentation using SemanticKITTI.
In the previous week, I had started a first Plotly-based LiDAR visualization experiment. This week I moved the LiDAR part closer to a complete GUI flow with dataset viewing, inference, and evaluation.
LiDAR Segmentation Dataset Viewer
The next main part of the week was the LiDAR segmentation GUI.
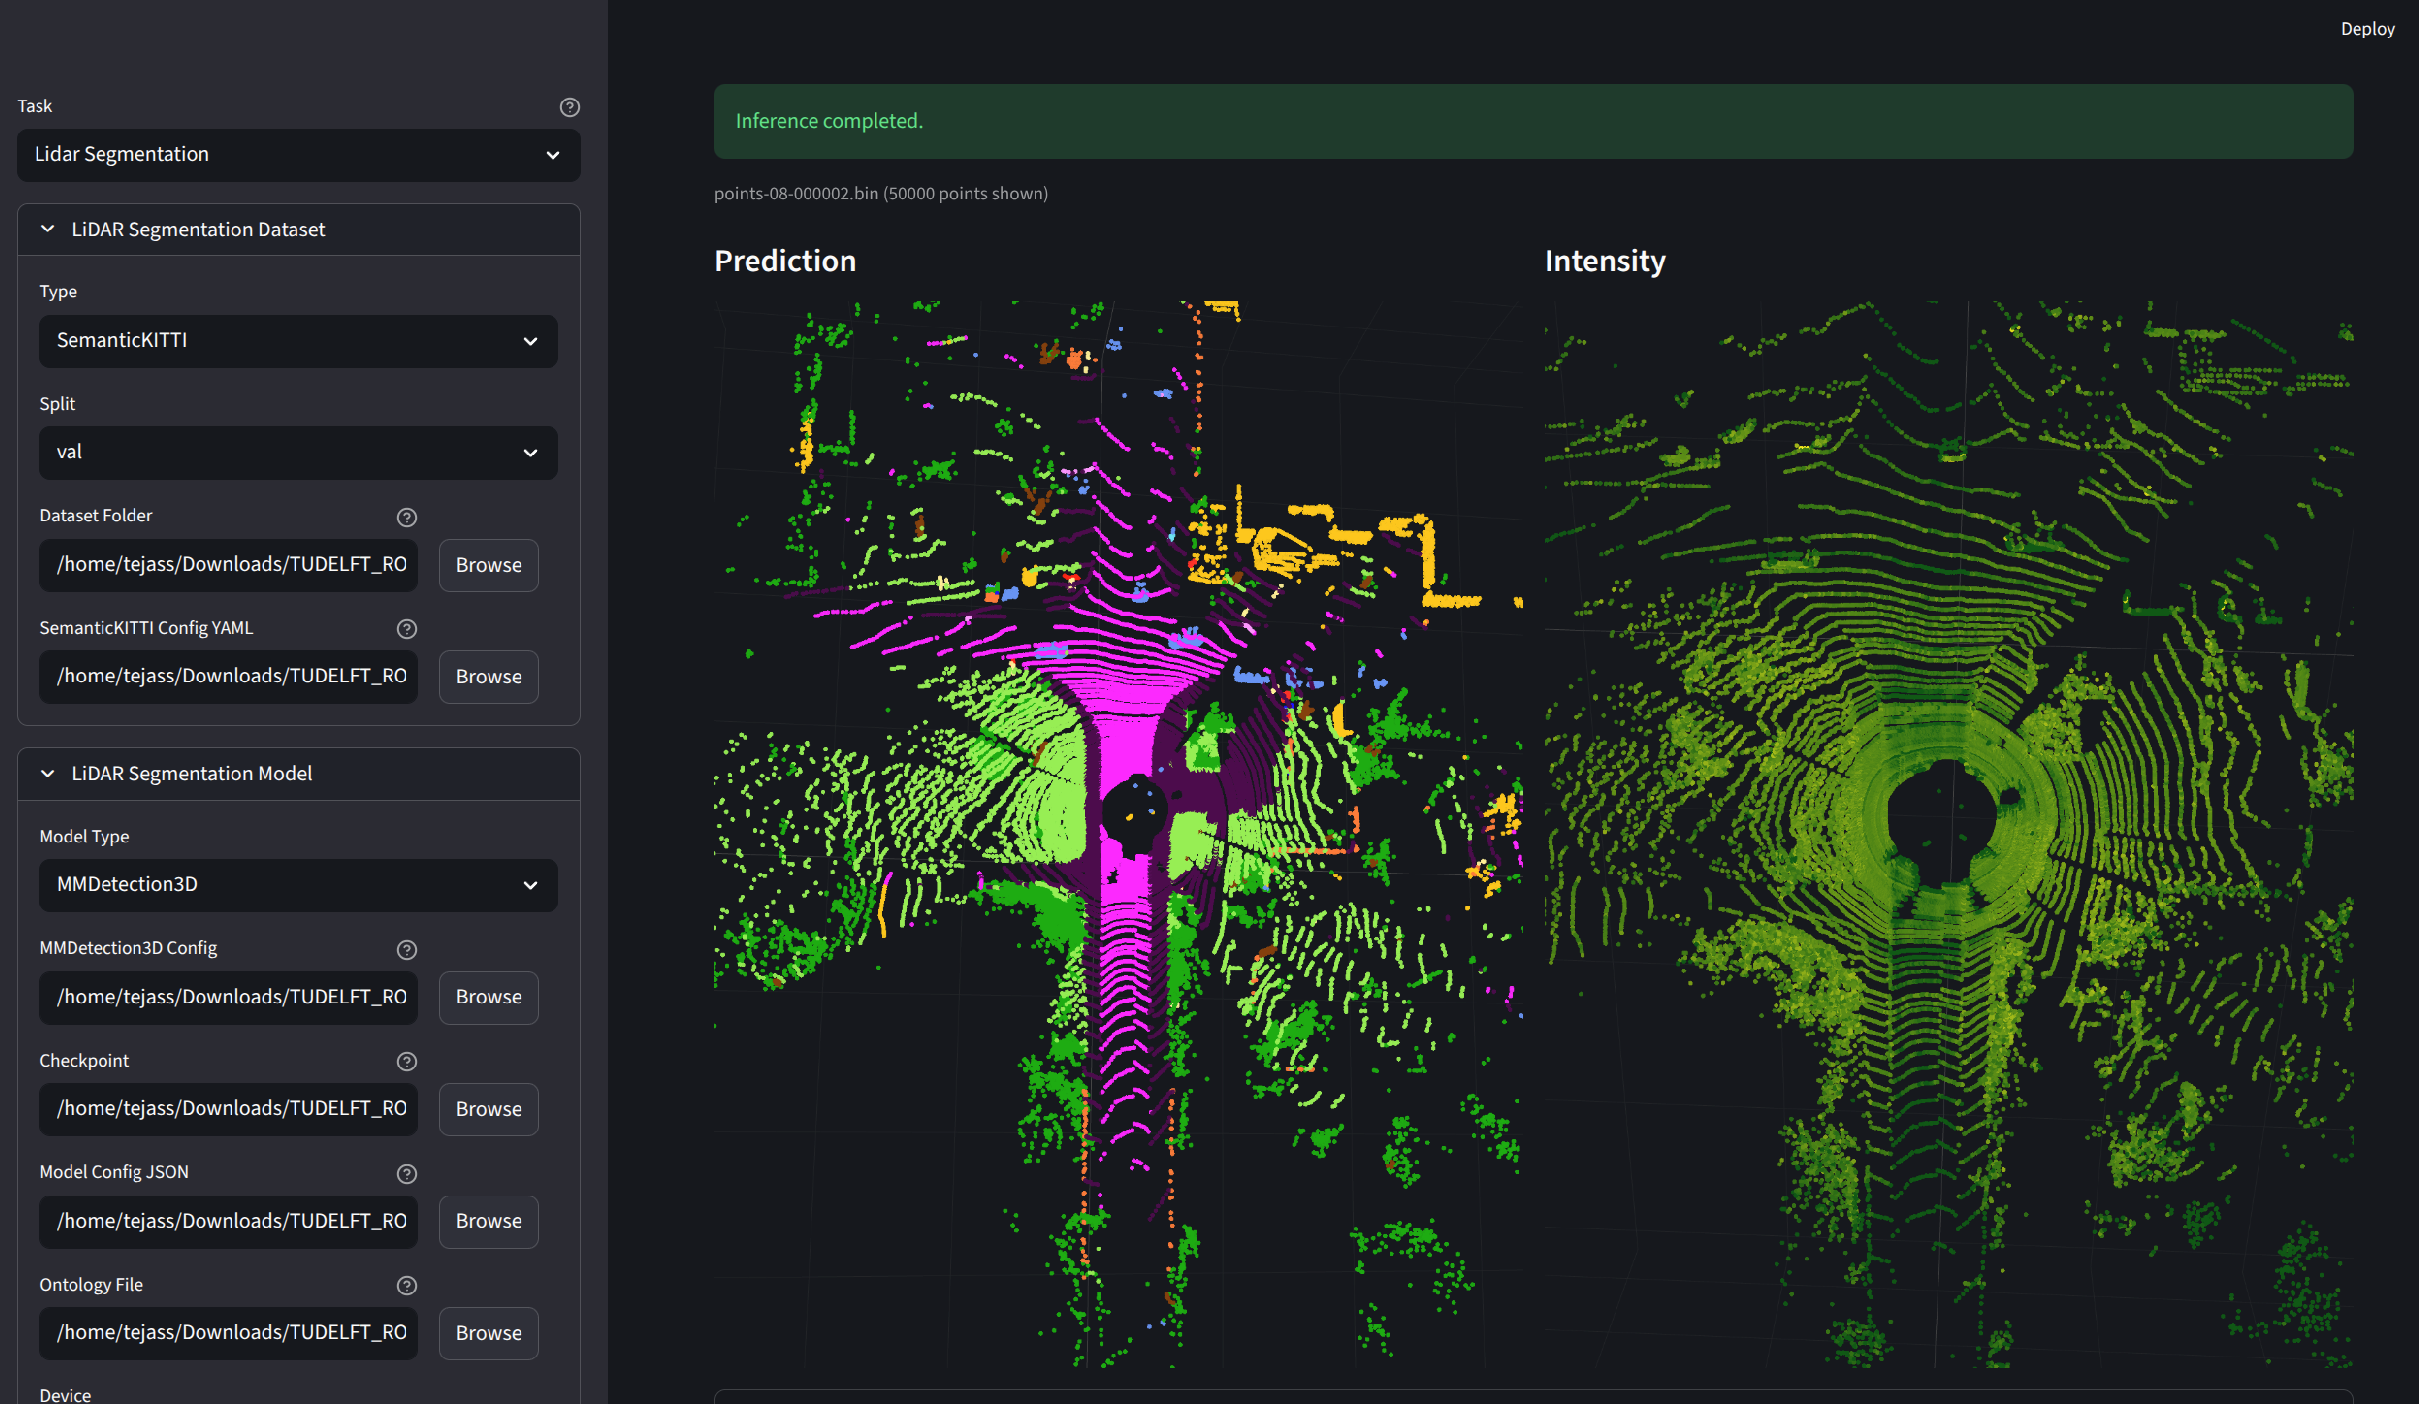
The dataset viewer now uses the SemanticKITTI dataset structure and lets the user select a split and frame from the GUI. The selected frame is rendered as an interactive 3D point cloud using Plotly.
I added support for two coloring modes:
- semantic label colors;
- intensity-based colors.
The intensity values come from the .bin point cloud file itself. SemanticKITTI point clouds store each point as x, y, z, intensity, so intensity is an input feature from the LiDAR data, not a model output.
When labels are available, the viewer can color points by class, A class table has been added to display the color mapping.
For the Plotly view, I added a top-view camera option. This makes it easier to reset the visualization to a useful view when the user rotates or zooms around the point cloud. I also added hover text so the user can see point coordinates and class names when label information is available.
LiDAR Segmentation Inference
The model wiring follows the SemanticKITTI tutorial. The GUI loads the model using the required model configuration, checkpoint, ontology, and PerceptionMetrics model configuration. Once the model is loaded, the inference tab can run prediction on a selected .bin point cloud.
The prediction is then visualized in the same Plotly point cloud viewer. This made it possible to compare the raw point cloud and the predicted semantic classes from inside the GUI.
One thing I had to handle carefully was how Streamlit file uploads work. Uploaded files are stored in memory, while the PerceptionMetrics LiDAR model prediction path expects a local file path. Because of that, the uploaded .bin file is temporarily written to disk before calling the model prediction function.
LiDAR Segmentation Evaluation
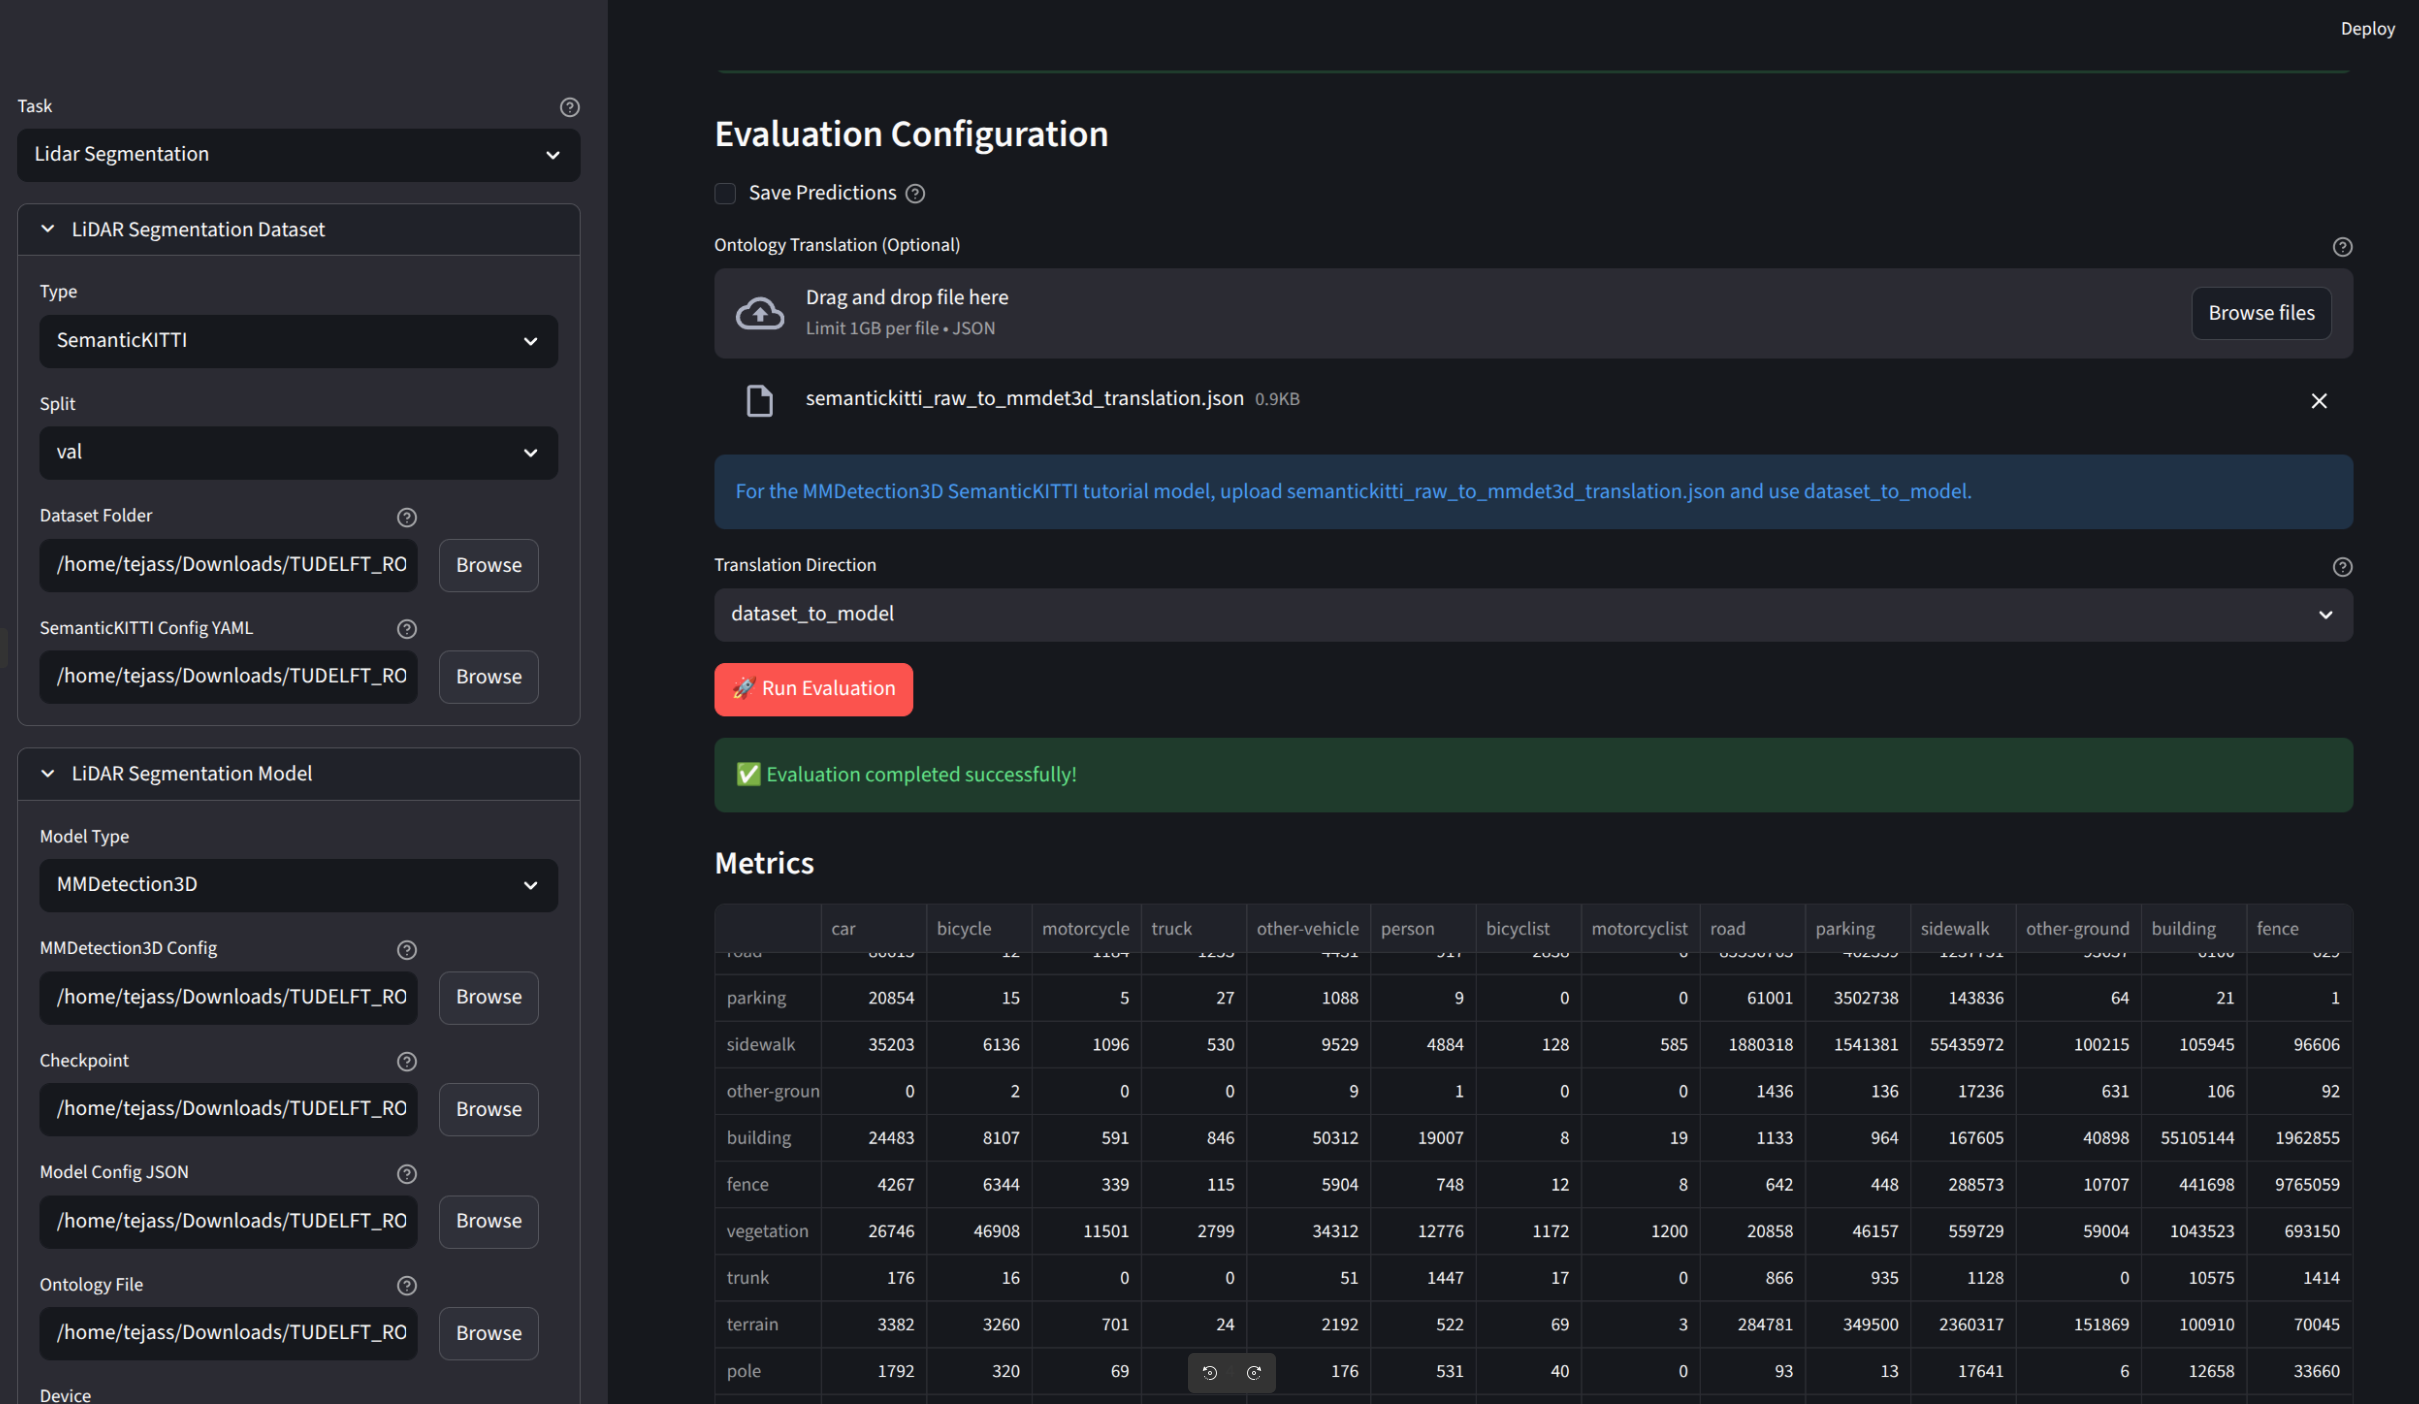
I also started wiring the evaluator tab for SemanticKITTI LiDAR segmentation.
The evaluator loads the dataset, checks that the model is available, and calls the model eval() function from PerceptionMetrics.
I added progress callbacks for LiDAR evaluation as well. This allows the GUI to show live progress while evaluation is running, instead of only showing results after the full dataset has finished.
The evaluator also supports ontology translation, since SemanticKITTI labels, train IDs, and model outputs may not always directly match. This follows the same idea used in the segmentation tutorials.
Next Steps
The next step is to test the LiDAR segmentation GUI more carefully with SemanticKITTI and clean up the code before opening a separate pull request for it.
Enjoy Reading This Article?
Here are some more articles you might like to read next: