Week 10: July 31 ~ Aug 06
Preliminaries
This week pivots towards furthur enhancing and evaluating the model. With the previously implemented evaluation metrics, we can now more thoroughly gauge our model’s performance. As the program enters its latter half, we would like to start transferring the work we have done so far to the Behavior Metrics platform. Tailored for benchmarking autonomous driving models, this platform allows users to load their models into predefined scenarios and obtain a detailed performance metric report. Currently, the platform only supports the lane-following task, where the agent doesn’t have to deal with obstacles (other vehicles and pedestrians), intersections, or traffic lights. An immediate goal for this week is to expand Behavior Metrics by introducing traffic, thus making its environment more dynamic and realistic.
Objectives
- Release posts for weeks 7 and 8
- Update codebase
- Refine and assess model performance
- Begin integration with Behavior Metrics platform
Execution
Model Evaluation
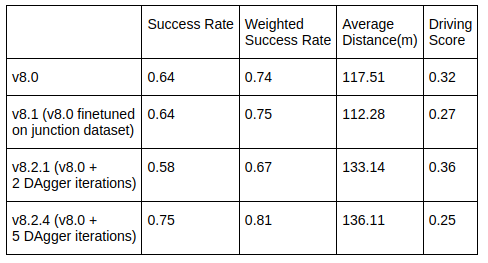
One intriguing finding from the evaluation is what appears to be an inverse relationship between success rate and the overall driving score. As shown in the image below, after five dagger iterations, the success rate is the highest but the overall driving score is the lowest. Let’s dissect the potential rationale:
The model is bad at obstacle avoidance. When the model strays from the designated path (for instance, by taking an incorrect turn), it invariably ends up with a subpar route completion score, denoted as \(R\). However, this deviation inadvertently minimizes its exposure to potential obstacles. On the contrary, when the agent actually drives all the way to the target location, it is more likely to collide with other vehicles, resulting in a significanlty lower infraction penalty score \(P\), contributing to a diminished overall driving score, \(PR\).
Another issue is once a collision with a front vehicle occurs, the agent is likely to repeatedly bump into the same vehicle as they both move forward staying very closely to each other, causing the infraction penalty score to decrease exponentially.
v8.2.4 Demo
As shown in the demo below, after five DAgger iterations, the agent is able to follow the lane and follow instructions to make turns without much trouble, but lacks in avoiding obstacles, which we will work on in the upcoming weeks.
Traffic Generation in Behavior Metrics
This week, we began working on integrating traffic generation for CARLA tasks in Behavior Metrics. For updates on this, check the issue we opened on the Behavior Metrics Github page.
We had some difficulty with generating pedestrians. An issue arises with the carla-birdeye-view dependency of Behavior Metrics. When this tool tries to create a bird’s eye view for pedestrians, it runs into a NaN error. This happens because the tool mistakenly identifies the AI controllers used by pedestrians as pedestrians themselves, leading to errors when it tries to read their bounding boxes. We’ve reported this on the carla-birdeye-view Github page.
Enjoy Reading This Article?
Here are some more articles you might like to read next: