Week 6: July 03 ~ July 09
Preliminaries
The main objective for this week is to develop more sophisticated evaluation metrics beyond the existing success rate and average distance traveled before a collision. Specifically, we intend to incorporate metrics from the CARLA Leaderboard into our evaluation process, which take into account route completion and traffic infractions when calculating a score for model performance.
Objectives
- Finish editing the demo video
- Develop advanced evaluation metrics
- Debug CARLA 0.9.14 segmentation label issue
- Study evaluation metrics in Behavior Metrics
Execution
Current models
Following the upgrade to CARLA 0.9.14, due to the changes in the semantic segmentation labels, we had to retrain our previous models which were initially trained under CARLA 0.9.13. Below is a summary of the current state of our models (see previous post for model architectures):
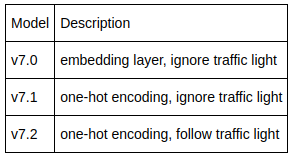
By comparing v7.0 and v7.1, we aim to discern whether one-hot encoding or an embedding layer leads to superior performance. Furthermore, by comparing v7.1 and v7.2 and specifically observing the number of traffic light infractions, we can evaluate how effectively model v7.2 has learned to adhere to traffic light signals.
Evaluation Metrics
Following the scoring system of the CARLA Leaderboard, we have updated our evaluation metrics as follows:
- Driving Score: \(R_i P_i\) where \(R_i\) represents the percentage of completion of the \(i\)-th route and \(P_i\) the infraction penalty of the \(i\)−th route.
- Route Completion: This metric represents the percentage of the route completed. For each testing route, we pre-calculate the total length of the route by letting an expert agent, i.e., the CARLA autopilot, drive through the route and measure the distance traveled from start to end.
-
Infraction Penalty: \(\prod_j (p_i ^j)^{\text{# of infractions}_j}\) where \(p^j\) is the penalty of infractions of type \(j\) as specified below:
- Collision with walker: 0.5
- Collision with other vehicle: 0.6
- Collision with static objects: 0.65
- Timeout: 0.7
- Running a red light: 0.7 The overall driving score will be the arithmetic mean of the driving scores of all routes.
Demo Video
Finally, we edited and uploaded a demo video for the Youtube channel. Check it out here:
Enjoy Reading This Article?
Here are some more articles you might like to read next: